on
Model Reflection
In this blog post, I’ll reflect on the performance of my model using actual results from the 2022 midterms. As a reminder, my final model found that Republicans were strongly favored to take the House. My model predicted that Democrats would win 200 seats and Republicans would win 235 seats. Moreover, I gave Democrats an 8.14% chance of winning the House.
In 80% of simulations of my model, Democrats won between 185 and 216 seats, and Republicans won between 219 and 250 seats.
The drop-down menu below displays histograms with my predictions for every district in the nation.
Accuracy of My Model
Clearly, my model underestimated Democrats chances, predicting they would win 200 seats when in reality they are on track to win 213. But this 213-222 final seat share was still a reasonably likely outcome according to my topline histogram, with this result sitting within the 80% prediction interval. This may suggest that although my final point prediction was off, my model did a better job considering the levels of uncertainty in the election.
Using the probabilities generated for each of my district forecasts, I calculated a Brier score for my model of 0.03396. And using the point predictions for each of my district forecasts in contested races, I calculated a root mean square error of 2.6852. According to Kiara’s calculations, FiveThirtyEight’s district models had a brier score of 0.032 and an RMSE of 3.99, so although my overall seat prediction was further from the mark, the accuracy of my model was in line with some of the major forecasters.
Listed below are the districts that I called incorrectly, sorted by the Democratic win percentage determined by my model.
| District | Winner | Dem_Win_Prob | Actual_Dem_Vote | Predicted_Dem_Vote | Lower | Upper |
|---|---|---|---|---|---|---|
| WA-03 | Democrat | 5.91 | 50.48 | 41.70 | 32.84 | 50.57 |
| NC-13 | Democrat | 13.69 | 51.32 | 44.22 | 35.36 | 53.09 |
| OH-13 | Democrat | 18.13 | 52.59 | 45.26 | 36.40 | 54.13 |
| AK-01 | Democrat | 18.30 | 64.86 | 45.36 | 36.49 | 54.23 |
| CO-08 | Democrat | 22.22 | 50.38 | 45.99 | 37.13 | 54.86 |
| PA-17 | Democrat | 23.31 | 53.16 | 46.22 | 37.35 | 55.09 |
| NM-02 | Democrat | 26.26 | 50.35 | 46.62 | 37.75 | 55.49 |
| MI-03 | Democrat | 28.41 | 56.67 | 47.03 | 38.16 | 55.89 |
| ME-02 | Democrat | 31.49 | 51.80 | 47.43 | 38.56 | 56.30 |
| NC-01 | Democrat | 33.52 | 52.28 | 47.67 | 38.80 | 56.54 |
| OH-01 | Democrat | 34.20 | 52.46 | 47.88 | 39.01 | 56.74 |
| IL-17 | Democrat | 34.78 | 51.73 | 47.91 | 39.04 | 56.78 |
| IL-13 | Democrat | 40.88 | 55.89 | 48.77 | 39.90 | 57.64 |
| CA-13 | Democrat | 43.84 | 50.27 | 49.30 | 40.44 | 58.17 |
| PA-08 | Democrat | 43.84 | 51.25 | 49.11 | 40.24 | 57.98 |
| RI-02 | Democrat | 47.02 | 51.87 | 49.75 | 40.88 | 58.62 |
| OR-06 | Democrat | 47.23 | 51.14 | 49.72 | 40.85 | 58.58 |
| OR-04 | Democrat | 48.37 | 53.97 | 49.79 | 40.92 | 58.66 |
| CO-07 | Democrat | 48.70 | 57.65 | 49.74 | 40.87 | 58.61 |
| OH-09 | Democrat | 49.65 | 56.55 | 49.98 | 41.11 | 58.85 |
| IA-03 | Republican | 50.11 | 49.65 | 50.05 | 41.18 | 58.92 |
| CA-22 | Republican | 51.36 | 47.57 | 50.12 | 41.25 | 58.99 |
| NY-04 | Republican | 53.25 | 48.12 | 50.43 | 41.56 | 59.29 |
| VA-02 | Republican | 56.01 | 48.29 | 50.73 | 41.86 | 59.59 |
| NJ-07 | Republican | 63.31 | 47.70 | 51.76 | 42.90 | 60.63 |
| NY-17 | Republican | 84.55 | 49.53 | 55.29 | 46.42 | 64.16 |
I called 26 races incorrectly (FiveThirtyEight, for reference, called 23 incorrectly). Notably, 20 of these races were those that I initially called for Republicans but which on election day were won by Democrats, while only 6 of the districts that I predicted would go Democratic in fact went Republican. This aligns with my broader underestimation of Democrats.
Many of the districts that I called incorrectly were those that I had pegged as toss-ups. I gave Democrats a 50.11% chance of winning Iowa’s 3rd, so a Republican victory was the mere toss of a coin. In 12 of the districts I called incorrectly, I gave the actual winner at least a 40% chance of victory. Some of my bigger misses were upsets that came as a shock to everyone. I gave Democrat Marie Gluesenkamp Perez only a 5.91% chance of winning Washington’s 3rd District — FiveThirtyEight gave her only a 2% chance. Similarly, my model thought Democrat Sean Patrick Maloney would win New York’s 17th in 84.55% of simulations. FiveThirtyEight was less certain in Maloney’s victory but still confident enough to give him 70-30 odds. Other miscalled races came down to clear flaws in my methodology. I gave Democrat Mary Peltola only an 18.30% chance of winning Alaska’s at-large district, despite the conventional (and ultimately correct) wisdom that Peltola was competitive and even favored in the race. My forecast was off since it did not consider Alaska’s RCV system, the poor candidate quality of the Republicans in the race, or the quirks of Alaska politics.
The map below plots the districts that I called incorrectly.
Republicans won upset victories in two races in New York, and Democrats outperformed my model in districts across the Midwest and in South Carolina.
Turning now to my vote share point predictions, the histogram below plots the model’s error in contested seats (that is, the actual Democratic vote share minus the predicted Democratic vote share).
My point predictions are slightly skewed toward underestimating Democrats (the median error, for reference, is 0.70 percentage points). But the distribution of point prediction errors is still roughly centered around 0. In the majority of contested districts, my model was within 5 percentage points of the true Democratic vote share and within 10 percentage points for nearly all contested districts. A notable outlier is Alaska, though this is effectively just a data error caused by Alaska’s RCV system. (The data set only considers the votes of the top vote-getting Republican, rather than adding the votes of the two Republicans in the race or adjusting for RCV results in some way.)
The map below plots the errors across districts. Grey districts were either uncontested or had multiple Republicans or Democrats on the ballot.
Once again, Republicans overperformed my model in New York state, as well as Florida and parts of California. My model underestimated Democrats across the Midwest and in South Carolina.
Finally, the graph below plots the actual Democratic two-party vote share versus the predicted Democratic two-party vote share.
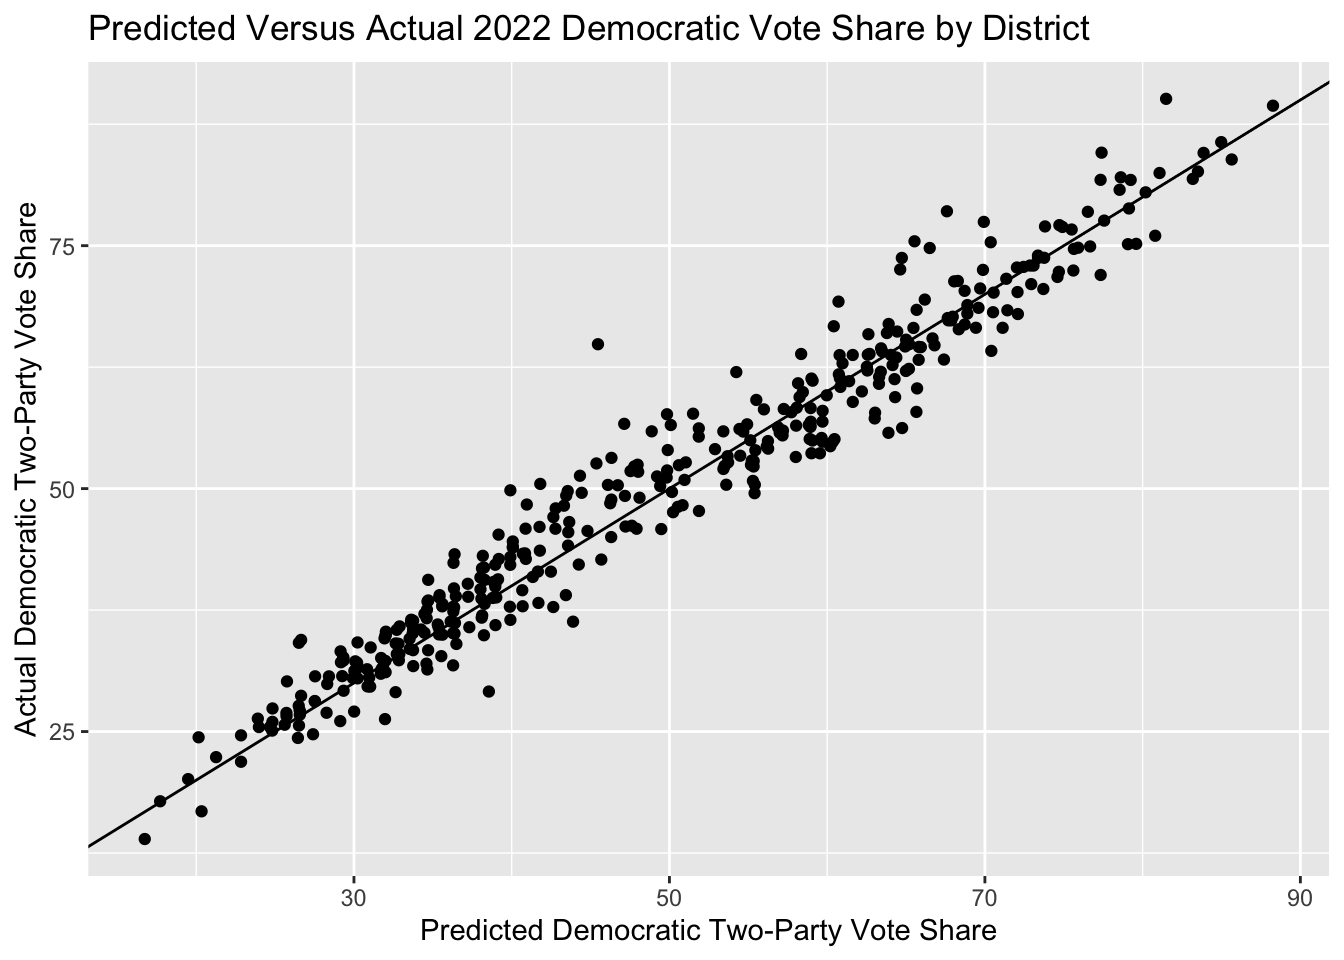
Overall, my predictions fairly closely map the actual results, with the districts generally following the 45-degree line.
Where I Went Wrong
I think my predictions were fairly reasonable given the outputs I was feeding my model. My forecast was based on fundamental conditions, such as the partisanship and demographics of districts and the fact this was a midterm election cycle with an incumbent Democratic president. These fundamentals seemed to be objectively bad for Democrats, based on the historical data my model is based off of. My model also incorporated national polling, and since it was trained on polling data which had had a pro-Republican bias in recent years, the model expected another modest Republican polling bias. These factors led to overestimating Republicans’ chances.
In particular, I was unable to consider significant regional variations in party performance. This midterm cycle saw a wide range in swings depending on the state: Florida and New York experienced Red Waves, while Michigan experienced a Blue Wave. But my model simply applied a national swing (based on the generic ballot polling average) to all districts and was thus unable to consider regional correlations.
I worry that this lack of consideration for state-based dynamics left my model unable to consider the particular quirks of this election cycle. As evidence for this, my model generally underestimated Democrats in places where Democrats overperformed Biden and the baseline partisanship of districts (the Midwest) and underestimated Republicans in places where Democrats underperformed Biden and the baseline partisanship of districts (Florida, New York, California). In other words, my model was overly reliant on district-level fundamentals like PVI, not anticipating the particular regional contexts of certain races in 2022.
To test this hypothesis further, I may run a regression between my model’s error and 2020-2022 district-level vote swing. If my model is indeed overly reliant on regional fundamentals, I’d expect a strong positive correlation between Democratic overperformance relative to my model and Democratic overperformance relative to 2020.
Improvements for Next Time
One way to address the pitfalls discussed above would be to consider the correlations between districts based on geographic proximity and demographic similarity. FiveThirtyEight’s CANTOR algorithm, for example, is able to make predictions for districts with sparse data based on data in similar districts. This would allow me to consider region- and demographic-based uncertainties rather than relying on a uniform swing model.
Another approach could be to consider the effects of top-of-ballot races on congressional elections. States in which Senate and gubernatorial candidates of a certain party performed well also tended to see that party fare well in House races (e.g. for Republicans, Ron DeSantis and Lee Zeldin; for Democrats, Gretchen Whitmer). In future models, I may therefore include polling for Senate and gubernatorial candidates, which provides a means of considering regional variations. It also provides a way to integrate potentially valuable state-level polling data that I did not consider this time around.