on
Final Prediction Model
National Seat Forecast
Republicans are strongly favored to take the House. My model predicts that Democrats will win 200 seats and Republicans will win 235 seats.
In 80% of simulations, Democrats win between 185 and 216 seats, and Republicans win between 219 and 250 seats.
District-Level Forecasts
Zoom and hover over this district map to get predicted vote share, win probability, and prediction intervals for every district.
Note: the template for this cartogram comes from Daily Kos Elections
Click through the drop-down menu to get histograms of simulations for every district.
Methodology
My model combines district-level demographic data, other fundamental indicators, and national polling data to generate predicted vote shares and win probabilities for every district in the country. These district-level estimates are then combined to determine a national-level seat forecast. I built my model in two main sections: a district-level pooled model based on fundamentals and a national vote share model based on generic ballot polls.
Pooled District-Level Fundamentals Model
This model combines district-level results from the past decade of House elections to predict the Democratic two-party vote share for a certain district. In my final model, I used the following variables.
PVI: The Cook Political Report’s Partisan Voter Index, a measure of the baseline partisanship of a district based on presidential election data.
Democratic incumbency: 1 if the Democratic candidate is an incumbent, 0 if not.
Democratic president: 1 if the incumbent president is a Democrat, 0 if not.
Midterm: 1 if it is a midterm election cycle, 0 if not.
White population: Proportion of the district’s voting age population that is white.
I considered other demographic variables, such as the Black proportion of the population, the proportion of the population under 29, etc., but decided not to use them either for the sake of parsimony or for the lack of corresponding data for the 2022 districts. The model output is shown below.| Dem Votes Major Percent | ||||
|---|---|---|---|---|
| Predictors | Estimates | std. Error | CI | p |
| (Intercept) | 47.41 | 0.87 | 45.71 – 49.12 | <0.001 |
| PVI num | 1.10 | 0.02 | 1.06 – 1.14 | <0.001 |
| dem inc | 8.25 | 0.59 | 7.09 – 9.41 | <0.001 |
| dem pres | -4.81 | 0.44 | -5.66 – -3.95 | <0.001 |
| midterm | -0.86 | 0.41 | -1.67 – -0.05 | 0.037 |
| white | 4.76 | 1.22 | 2.37 – 7.16 | <0.001 |
| Observations | 2590 | |||
| R2 / R2 adjusted | 0.795 / 0.795 | |||
Below is a plot of the actual Democratic vote share versus the predicted Democratic vote according to the model for all congressional races from 2010 to 2020. The red 45-degree line represents cases where the model perfectly predicts district-level results.
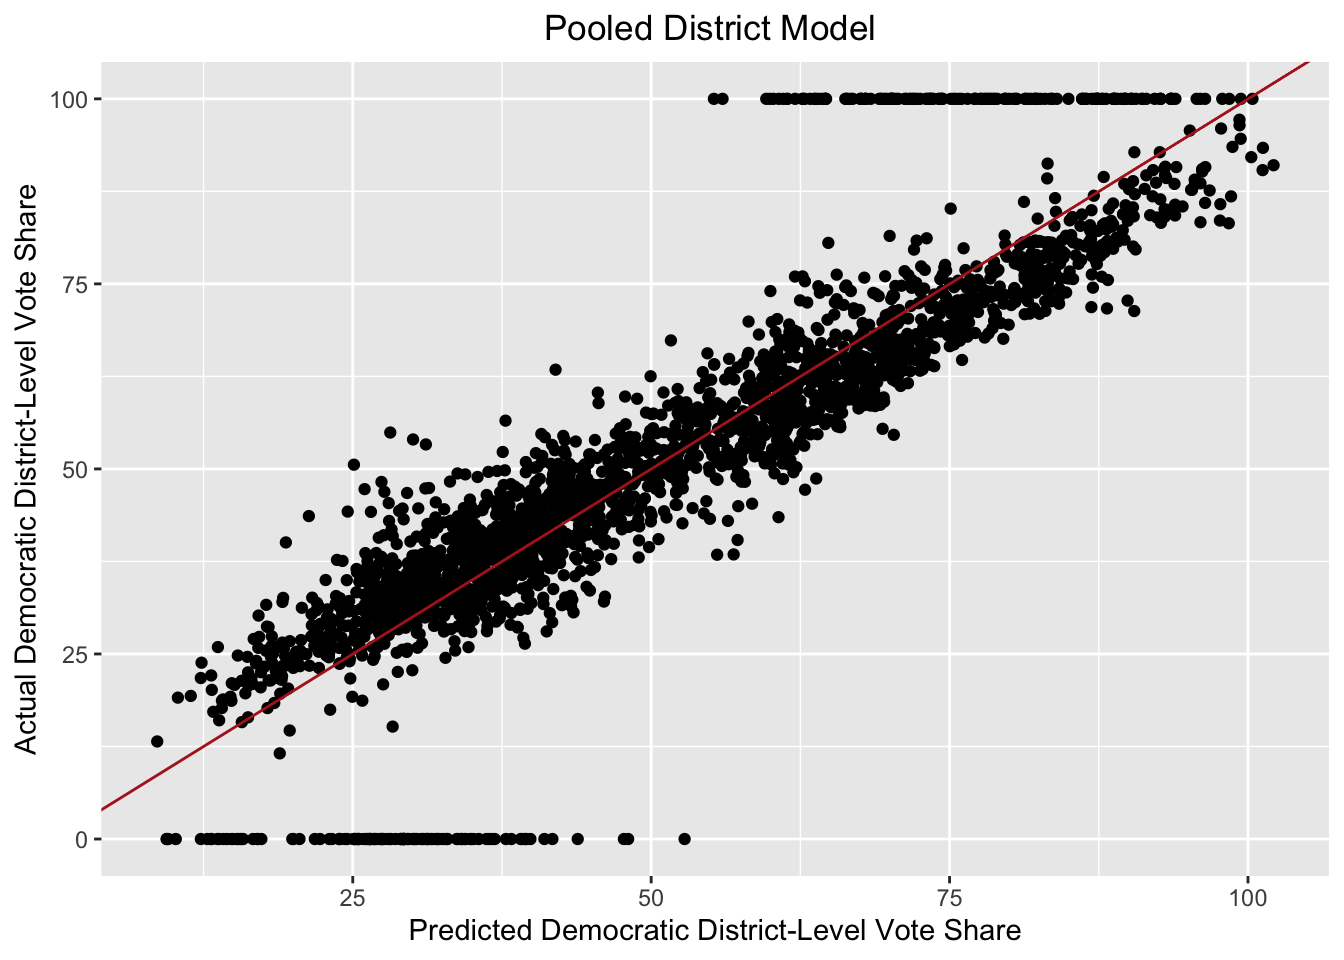
While this model performs well, uncontested districts (with actual Democratic vote share values of 0% or 100%) skew the regression. Thus, I ran the same model but filtered out uncontested districts.
| Dem Votes Major Percent | ||||
|---|---|---|---|---|
| Predictors | Estimates | std. Error | CI | p |
| (Intercept) | 49.50 | 0.44 | 48.65 – 50.36 | <0.001 |
| PVI num | 0.90 | 0.01 | 0.87 – 0.92 | <0.001 |
| dem inc | 6.53 | 0.29 | 5.96 – 7.09 | <0.001 |
| dem pres | -3.06 | 0.21 | -3.48 – -2.64 | <0.001 |
| midterm | -0.95 | 0.20 | -1.35 – -0.55 | <0.001 |
| white | 0.94 | 0.61 | -0.27 – 2.14 | 0.128 |
| Observations | 2304 | |||
| R2 / R2 adjusted | 0.918 / 0.918 | |||
As before, nearly all the variables are statistically significant, this time which the exception of the white proportion of the district population. And this model now seems to fit our data better, with the adjusted R-squared up to 0.919. Below is a plot of predicted versus actual Democratic vote share for only uncontested seats.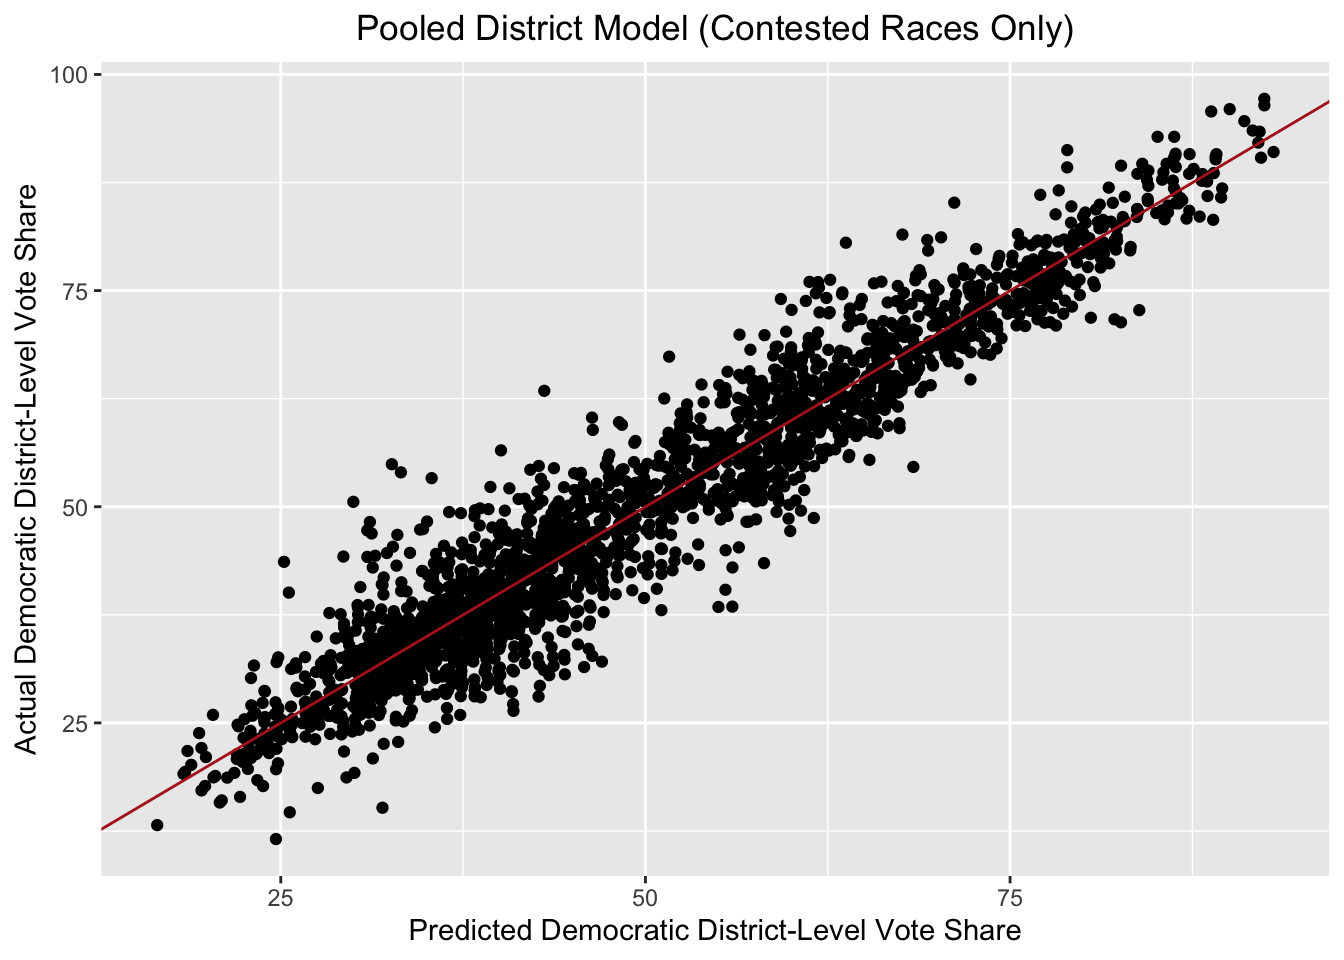
This model clearly fits the data quite well, with the high R-squared pointing to strong in-sample performance. One concern I have is that I may be overfitting, though the model continued to perform well under out-of-sample testing (calculated by removing an entire year from the training data).
Thus the final equation for this model is given by dem_two_party_voteshare = 0.9(PVI) + 6.53(dem_inc) – 3.06(dem_pres) – 0.95(midterm) + 0.94(white) + 49.50. Note that, as we might expect, a Democratic incumbent running in a district predicts higher Democratic vote share, while having a Democratic president and a midterm election year is associated with poorer Democratic performance.
Using data updated for the 2022 districts from Dave’s Redistricting, I ran this model for all 435 congressional districts, generating two-party vote share estimates and 80% prediction intervals. Then I simulated 10,000 elections in each district, using the predicted two-party vote share and residual standard error.
National Generic Ballot Model
But this district-level pooled model is flawed on its own when attempting to convert to a national estimate for seat share. The pooled model generates predictions for each district independently. In reality, a particular party performing well in a certain district should generally be correlated with that party doing well across the board. Thus, when I aggregated the 10,000 simulations to form a national seat share prediction, the model was very overconfident, since it wasn’t considering cases where Democrats consistently performed well or poorly across districts. I thus turned to national polling to consider cases where a certain party outperforms the district fundamentals.
Using historical polling and election data, the following simple linear model predicts national Democratic two-party vote share based only on generic ballot polling, with individual polls filtered by recency to generate polling averages.| D majorvote pct | ||||
|---|---|---|---|---|
| Predictors | Estimates | std. Error | CI | p |
| (Intercept) | 12.52 | 5.45 | 1.25 – 23.78 | 0.031 |
| dem two party | 0.73 | 0.10 | 0.52 – 0.94 | <0.001 |
| Observations | 25 | |||
| R2 / R2 adjusted | 0.697 / 0.684 | |||
A scatterplot for the model is shown below.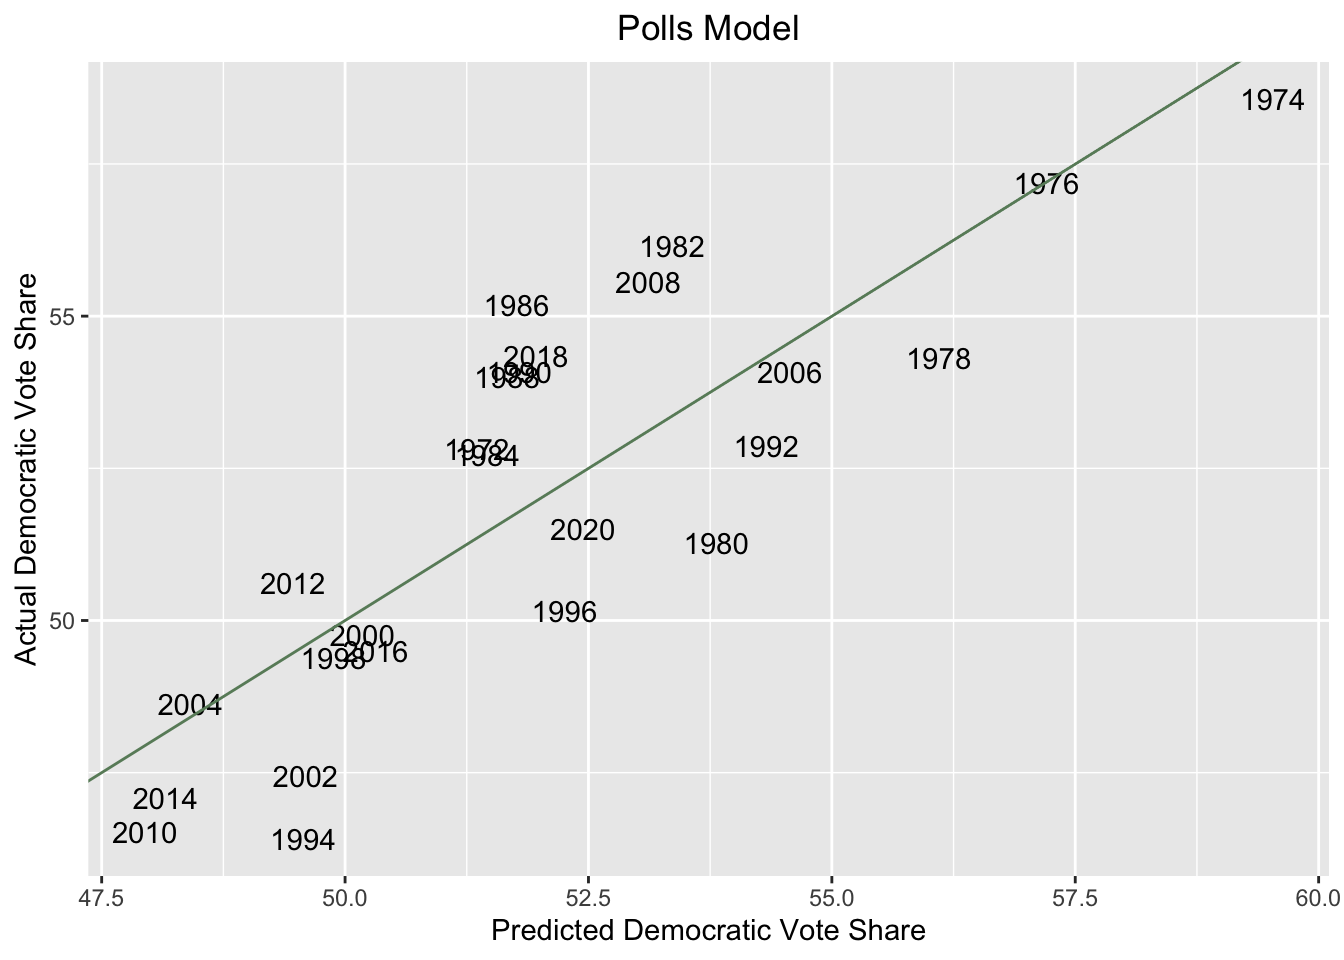
And the equation for this model is given by dem_two_party_voteshare = 0.73(two_party_generic_ballot_avg) + 12.52. Note that the coefficient for the generic ballot variable is below one, suggesting that two-party generic ballot average tends to overestimate Democrats’ national vote share, which this model takes into account.
Using 2022 polling data (again filtered by recency), I calculated the 2022 polling average and fed it through this model to determine an estimate for the national two-party Democratic vote share as well as an 80% prediction interval. I used this estimate and the residual standard error to conduct 10,000 simulations of the national two-party vote share. These simulated results thus represent possible true estimates for the national two-party vote, based on historical polling error (and in particular, the polls’ propensity to overrate Democrats’ chances).
Finally, I used these simulated vote shares to represent possible values of the baseline national environment (e.g. a simulated Democratic two-party vote share of 52% represents a D+2 environment). Then, I adjusted the previously calculated district-level simulations by these measures of national partisanship. Notably, this makes the assumption of uniform swing (i.e. that national shifts cause all districts to move in the same direction, at the same magnitude). But in this way, I am able to consider both district-level uncertainty using the pooled model and the possibility of a unidirectional polling error using the national model’s adjustment.
Adjusting the pooled model by the national model, I generated the final vote share predictions and prediction intervals for each district that are plotted on the cartogram as well as the 10,000 simulations plotted on the district-level histograms. Then, for each simulation, I aggregated the number of seats won by Democrats to generate 10,000 national seat share predictions, shown on the topline histogram. These seat share simulations now feature a greater degree of uncertainty given the uniform swing adjustments created by the polling model. Despite the relatively large prediction interval, the model is quite confident in Republicans’ chances (giving Democrats only an 8.14% chance at a majority) mainly because the mean of the distribution has Democrats only winning 200 out of 435 seats.
Limitations
As previously mentioned, the implementation of my polling model presumes a national swing, which may not be a fair assumption. Certain demographically similar districts may be correlated and swing together while others do not.
Moreover, I decided to omit district-level polling (due to the sparseness and potential unreliability of the data) and expert predictions (to preserve the intellectual exercise of making this model). But these data points could have helped refine my district-level predictions to incorporate information beyond the fundamentals considered in my pooled model. For example, expert predictions and polling suggest that Democrat Mary Peltola is competitive and even favored in Alaska’s at-large congressional district, but my model — turning to the baseline partisanship of the district — only gives Peltola an 18.3% chance of winning. My model also has no way to account for Alaska’s ranked-choice voting electoral system.
Still, as an exercise in considering how some measures of district-level fundamentals and national polling can be used to model midterm elections, I think my predictions seem broadly reasonable, if somewhat more pro-Republican than other forecasts and my own priors.