on
Blog 7: Building a Pooled District-Level Model
This blog is an ongoing assignment for Gov 1347: Election Analytics, a course at Harvard College taught by Professor Ryan Enos. It will be updated weekly and culminate in a predictive model of the 2022 midterm elections.
For my last blog post until my final prediction, I’m going to construct a pooled district-level model to predict Democratic vote share based on the demographics of the districts. It became clear that a pooled model — rather than 435 distinct models for each district — would be necessary to predict district-level results. Due to decennial redistricting, the 2022 congressional districts are different from those used in previous districts. It is thus not appropriate to predict vote share in a particular district based on previous results in that district since the people living in that district have shifted. Meanwhile, we have no data to predict results in new districts like Montana’s Second. Moreover, working with separate district level models means that there are only around 4-5 data points to train my model on — not enough to make statistically solid predictions.
Using data from the 2010 through 2020 congressional elections, I constructed the following pooled model.
| Dem Votes Major Percent | ||||
|---|---|---|---|---|
| Predictors | Estimates | std. Error | CI | p |
| (Intercept) | 52.70 | 2.91 | 47.00 – 58.41 | <0.001 |
| PVI num | 1.11 | 0.02 | 1.06 – 1.15 | <0.001 |
| dem inc | 8.09 | 0.59 | 6.93 – 9.25 | <0.001 |
| dem pres | -4.51 | 0.45 | -5.38 – -3.63 | <0.001 |
| midterm | -0.74 | 0.41 | -1.55 – 0.07 | 0.072 |
| white | 4.09 | 1.41 | 1.32 – 6.85 | 0.004 |
| age20 29 | 23.93 | 7.98 | 8.28 – 39.58 | 0.003 |
| age30 44 | -35.73 | 8.37 | -52.15 – -19.32 | <0.001 |
| Observations | 2590 | |||
| R2 / R2 adjusted | 0.797 / 0.796 | |||
In the above model, PVI represents the Cook Political Report’s partisan voter index for that district in a particular election year, which is a measure of how Republican or Democratic a district is relative to the nation as a whole. The dem inc, dem pres, and midterm variables are dummy variables for whether the district has an incumbent Democratic candidate, whether the incumbent president is a Democrat, and whether it is a midterm cycle. The white, age 20-20, and age 30-34 represent the proportion of the district’s population that is white, aged 20-29, and aged 30-44 respectively. All of the variables are statistically significant, with the exception of the midterm dummy, which has a p-value of around 0.072. Below is a plot of the actual Democratic vote share versus the predicted Democratic vote according to the model for all congressional races from 2010 to 2020. The red 45-degree line represents cases where our model perfectly predicts district level results.
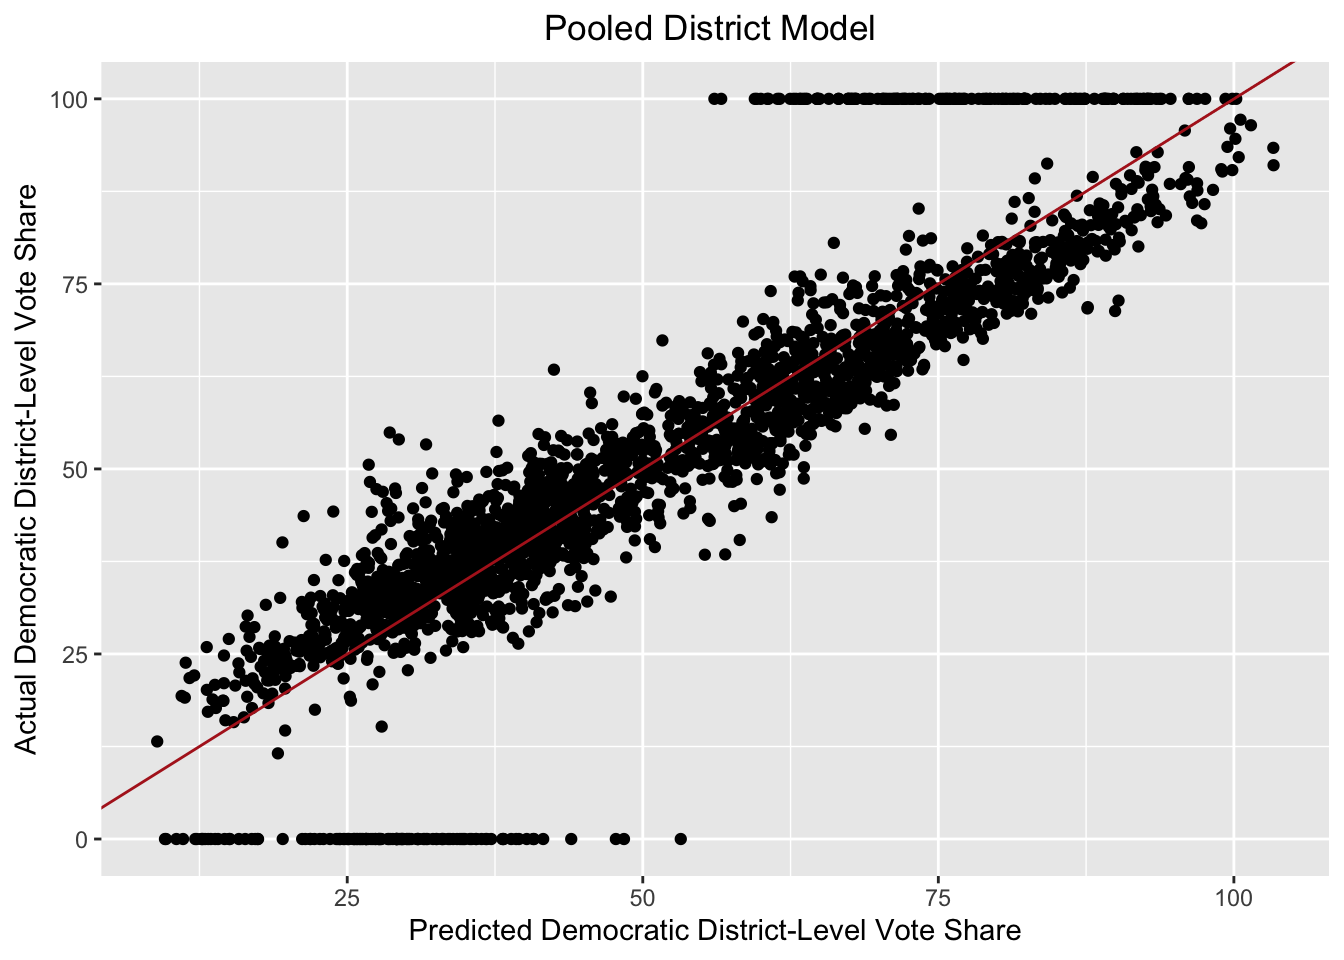 Note the districts with 0 or 100% Democratic vote share, which come from uncontested races. These districts may be skewing our model since one party will win all of the two-party vote regardless of the demographics of the district. The following model is trained on the same data as before but excluding uncontested districts.
| Dem Votes Major Percent | ||||
|---|---|---|---|---|
| Predictors | Estimates | std. Error | CI | p |
| (Intercept) | 51.34 | 1.43 | 48.54 – 54.15 | <0.001 |
| PVI num | 0.90 | 0.01 | 0.88 – 0.92 | <0.001 |
| dem inc | 6.40 | 0.29 | 5.84 – 6.97 | <0.001 |
| dem pres | -2.92 | 0.22 | -3.35 – -2.49 | <0.001 |
| midterm | -0.89 | 0.20 | -1.29 – -0.49 | <0.001 |
| white | 0.95 | 0.70 | -0.43 – 2.33 | 0.178 |
| age20 29 | 19.19 | 4.02 | 11.31 – 27.06 | <0.001 |
| age30 44 | -20.82 | 4.14 | -28.93 – -12.71 | <0.001 |
| Observations | 2304 | |||
| R2 / R2 adjusted | 0.919 / 0.919 | |||
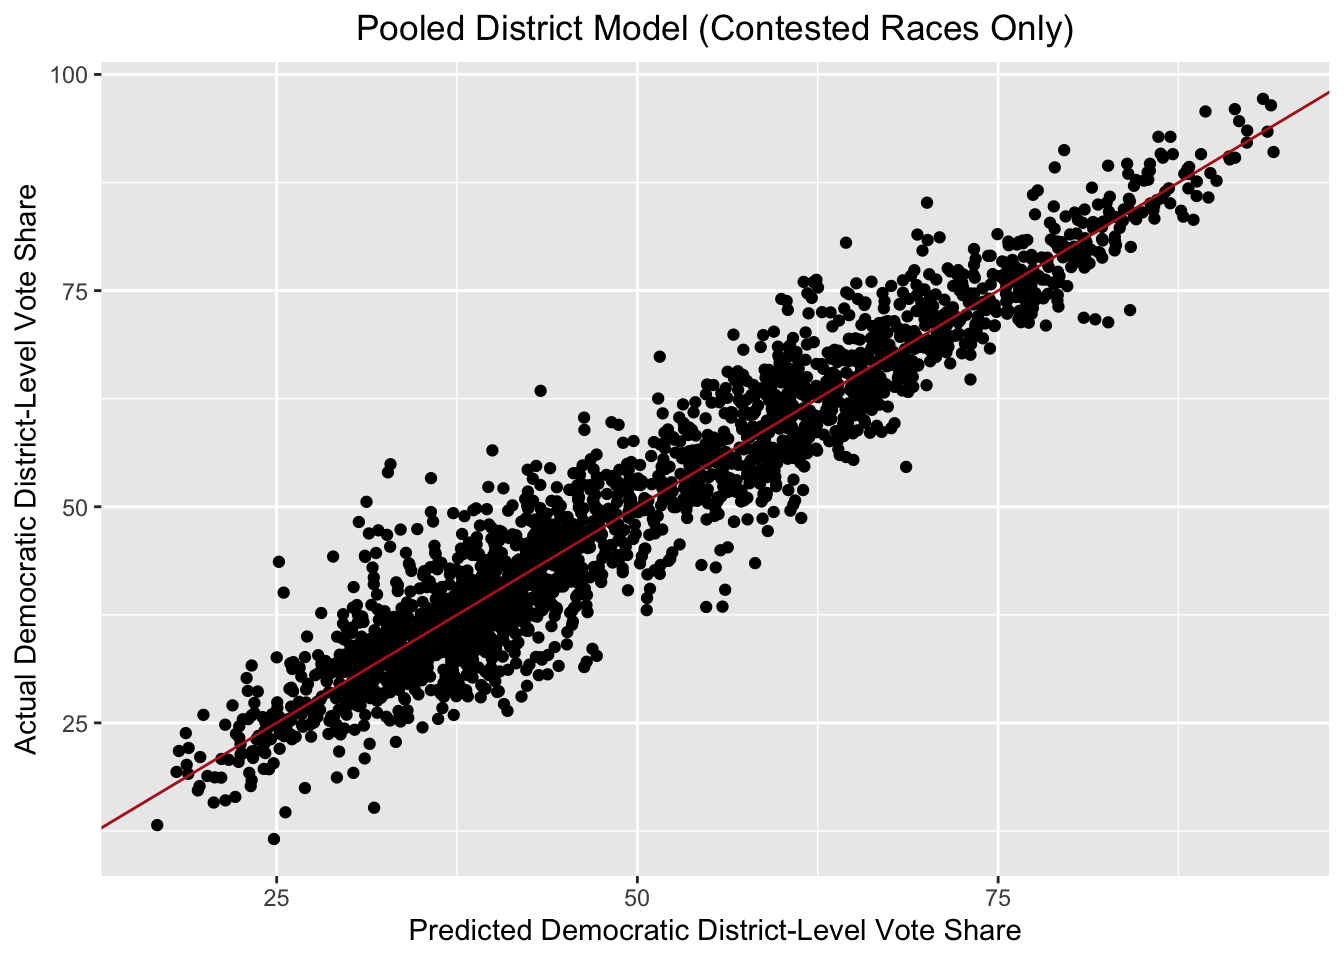
As before, nearly all the variables are statistically significant, this time which the exception of the white proportion of the district population. And this model now seems to fit our data better, with the adjusted R-squared up to 0.919. Below is a plot of predicted versus actual Democratic vote share for only uncontested seats.
 At this point, I will withhold from making predictions for 2022 as I still need to gather and wrangle post-redistricting district-level demographic data. But for now, this pooled model seems provide a good approach for translating demographic information about districts (as well as incumbency) into Democratic vote share.
One potential concern given how high the R-squared is is that I may be overfitting. Just throwing demographic data into the model might fit historical data well but it may not prove to be an effective basis for prediction. As I continue to refine my model, I’ll consider dropping variables to make my model more parsimonious and conduct cross validation to check my model’s predictive power.