on
Week 6: The Ground Game and Probabilistic Models
This blog is an ongoing assignment for Gov 1347: Election Analytics, a course at Harvard College taught by Professor Ryan Enos. It will be updated weekly and culminate in a predictive model of the 2022 midterm elections.
The main focus of my blog this week will be transferring my linear model to a probabilistic model. I’ll thus complete blog extension three as I create a binomial logistic regression model for every congressional district in the country.
As this is my first probabilistic model of the cycle, I’ll use a fairly simple linear model to get started. I will predict Democratic major vote share in each congressional district based on national generic ballot polling and whether the Democratic candidate is a challenger or an incumbent. I’ll use data from the 2012 to 2020 House elections to keep the shape of districts consistent over the period being modeled (see more on redistricting later). Before creating a generalized linear model, I’ll first run a simple linear regression to make sure this model at least somewhat accurately predicts vote share in congressional districts.
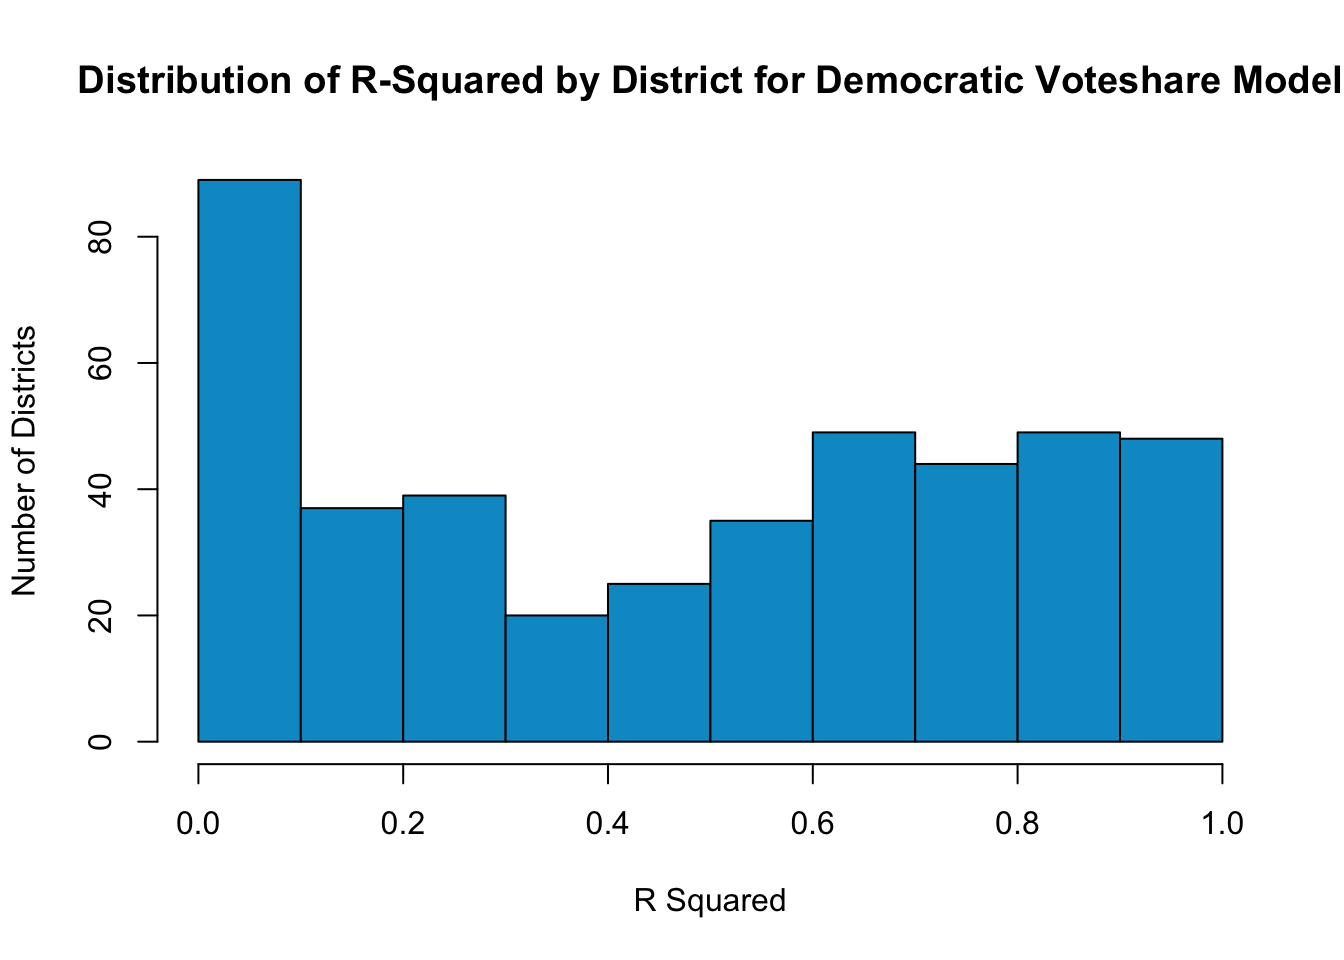
The histogram below plots the distribution of the R Squared values for the model predicting Democratic district vote share based on generic ballot polling and district-level incumbency.
The histogram below does the same but for the model predicting Republican district vote share.
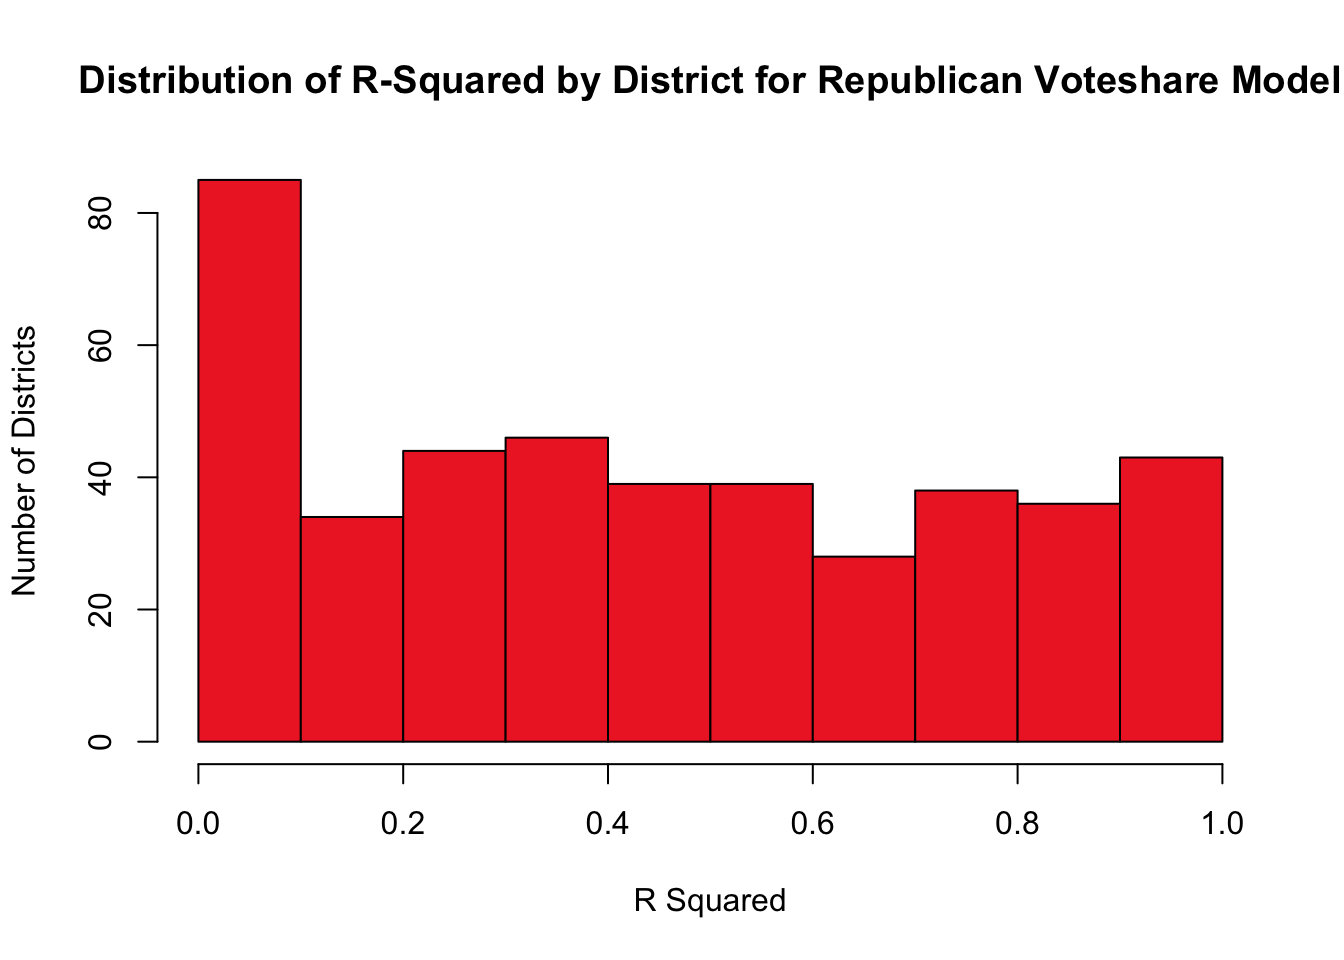
There’s clearly a wide range in R-squared values for both models, which is to be expected since we are only predicting based on two variables over five data points. But this will do for now. I’ll turn to building binomial logistic models for every congressional district to derive a probability that each party will win a certain race. Using cvap data and the data used for the previously defined linear regressions, I constructed binomial logistic models for every House district. Then, I predicted probabilities for the 2022 race by using the current 538 generic ballot polling average. Having now found the predicted probabilities for each party in each congressional district, I ran 10,000 trials to predict the number of voters who will turn out for each party in each district in 2022, again relying on cvap data to determine the number of eligible voters in each district. Finally, I calculated the simulated vote share margin across the 10,000 simulations in each district.
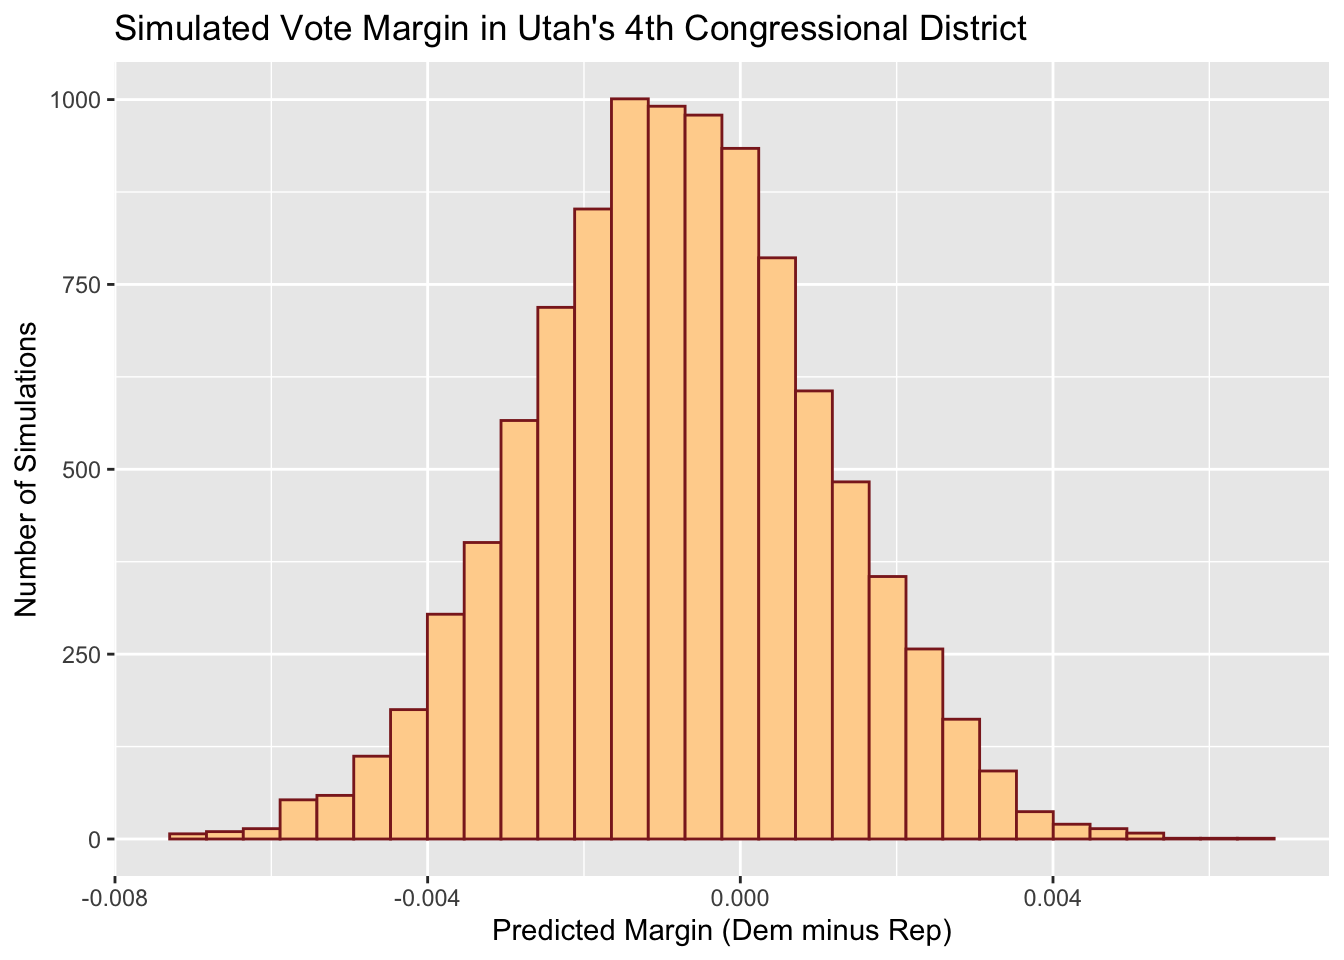
Plotted below, for example, is a histogram of the predicted vote margin in Utah’s 4th congressional district, which my model things will be a particularly competitive district. Values above 0 represent outcomes where the Democratic candidate wins and outcomes below 0 represent outcomes where the Republican candidate wins. So in this case, my model gives the Democrat around a roughly 32.7% chance of winning based on the 10,000 simulations.
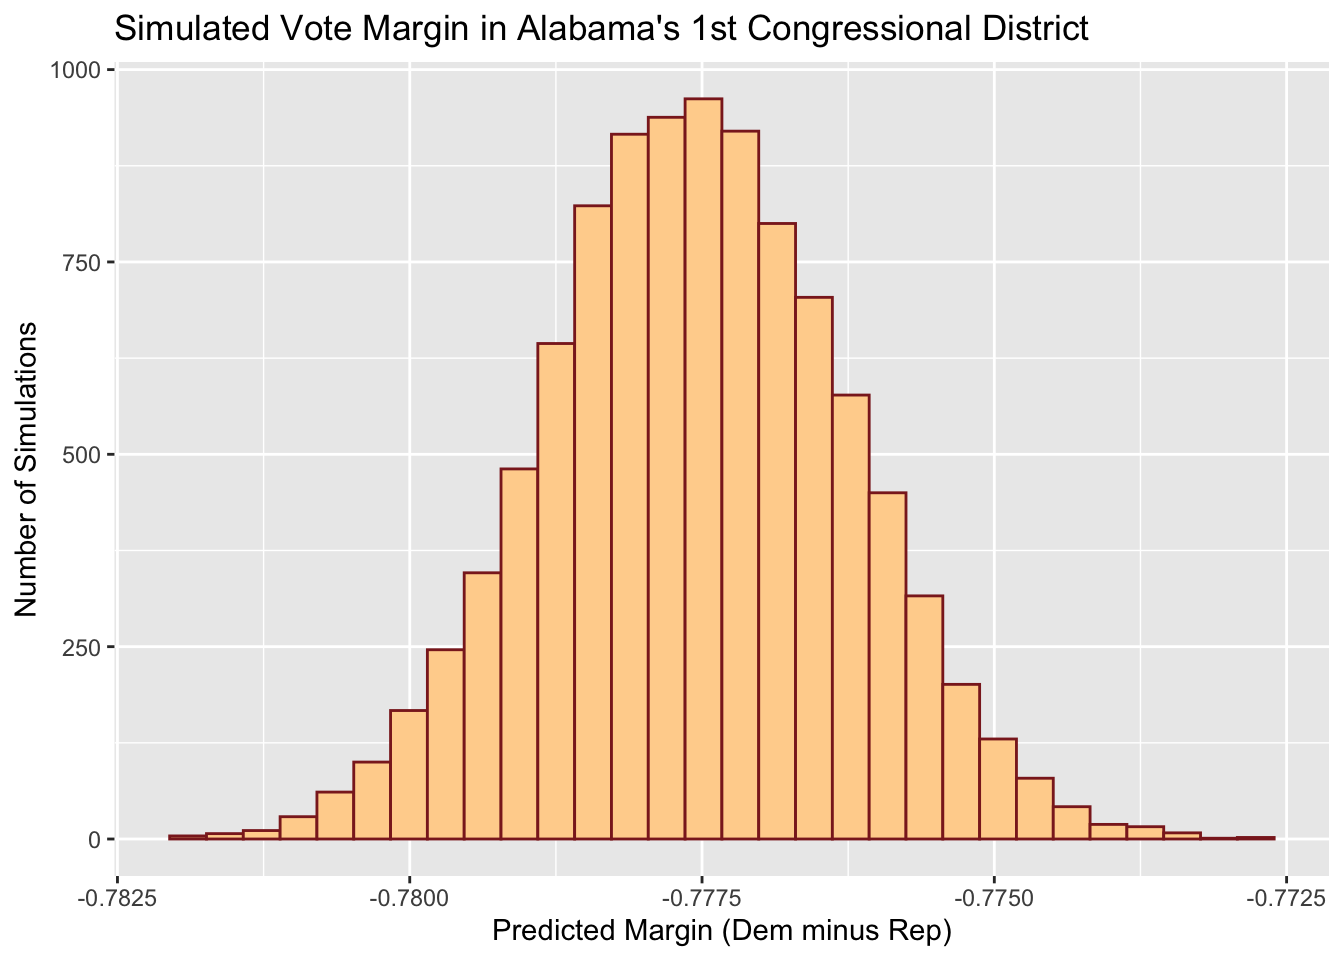
 Other districts aren’t nearly as competitive. My model for Alabama’s 1st, for example, shows the Republican winning in every simulation, as the histogram below shows.
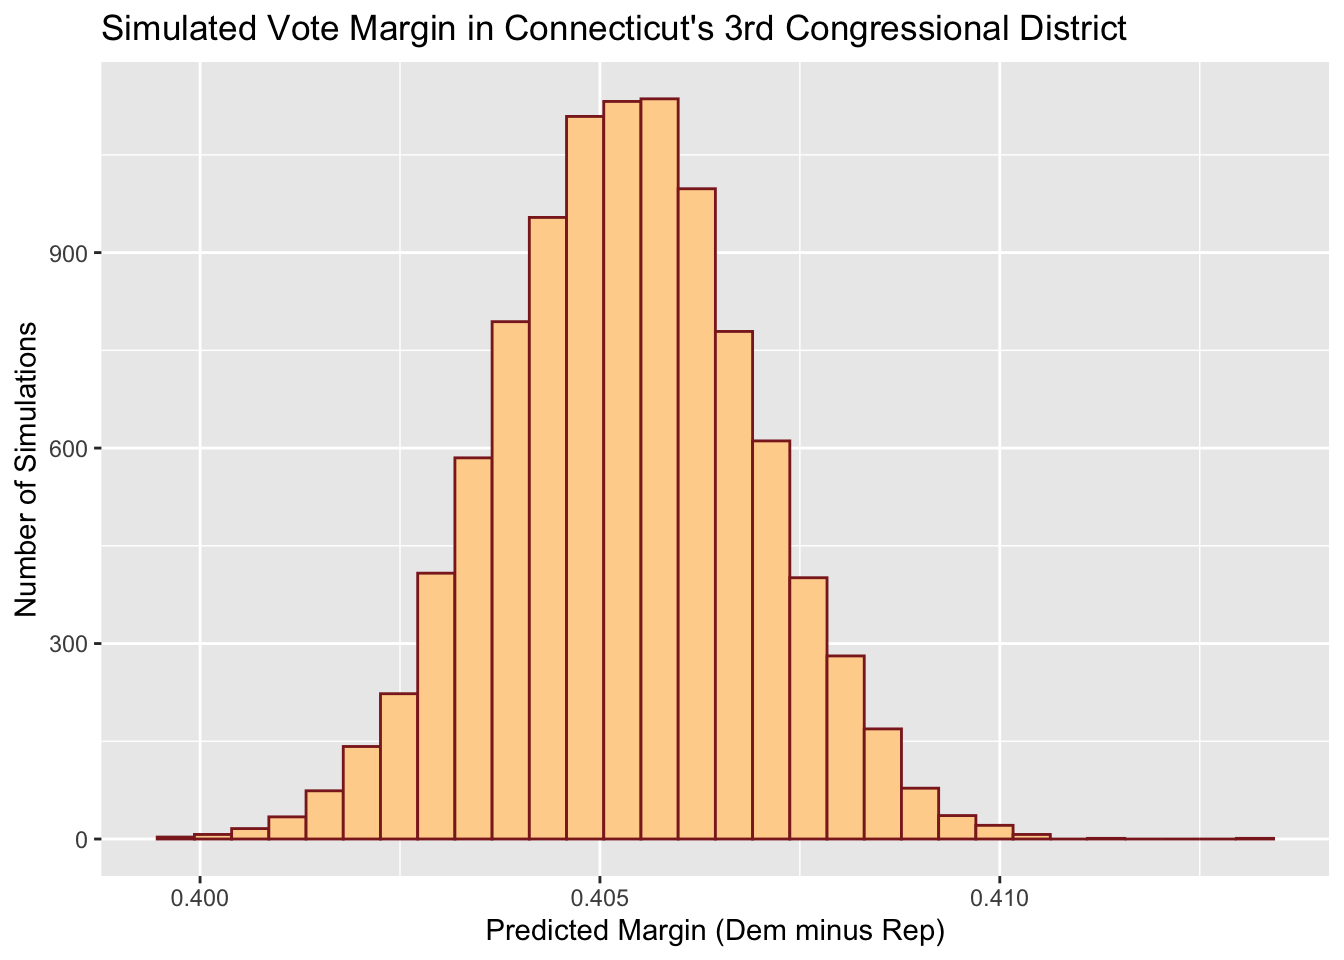
 Meanwhile, a safer blue district like Connecticut’s 3rd has Democrats winning every simulation, as plotted below.
I won’t plot all 435 histograms here, but in adding up all of the districts in which a Democratic wins a majority of the simulations, my model predicts that Democrats will win roughly 209 out of the 435 seats (around 48% of the seats).
It is important to note two flaws in this approach. First, there’s the issue of redistricting. The 2022 district maps are different from those used from 2012-2020, which is when the data used to train my model is from. Thus, it is not entirely appropriate to predict results in certain congressional districts based on previous results in those districts, since the boundary lines are different. Meanwhile, some districts, like Montana’s 2nd, are completely new due to decennial reapportionment, so there is no historical data that can be used to train a model for these districts.
Second, the simulations derived from my probabilistic models seem to not take into account enough uncertainty. A large proportion of districts had Democratic victory probabilities (i.e. P(dem - rep > 0)) of 1 or 0. While this to some extent reflects the decreasing number of competitive congressional districts in House elections, it still appears that many of my models are overconfident. There are districts that seem at least somewhat competitive but that my model predicts going Democrat or Republican with total certainty. As I build toward my final predictive model, I look to find workarounds to these two problems — redistricting and overconfidence — so that my predictions are sound.