on
Week 5: Advertising
This blog is an ongoing assignment for Gov 1347: Election Analytics, a course at Harvard College taught by Professor Ryan Enos. It will be updated weekly and culminate in a predictive model of the 2022 midterm elections.
This week, I’ll be trying to answer one central question: does advertising in midterm elections predict the results of congressional elections? As we don’t yet have access to 2022 advertising data, I won’t be able to make a prediction for 2022 districts. But I will put together a model that assesses the predictiveness of advertising on congressional election results.
Where Do Parties Run Ads?
Before constructing a model, I will first consider where political parties target their advertising. The map below plots the number of ads run supporting Democrats in House races in the run-up to the 2018 midterm elections.
The map below plots the number of ads in favor of Republican candidates.
Clearly, Republicans and Democrats tend to run ads in many of the same districts. This makes sense — both parties attempt to buy ads in the most competitive districts, while neither party believes it’s worthwhile to spend money in safe Republican and safe Democratic districts. In fact, the map below plots the races considered to be competitive in the run-up to the 2018 election, according to the Cook Political Report. Red districts lean Republican, blue districts lean Democratic, and purple districts are toss-ups. All other grey districts are either considered likely Republican/Democratic or solid Republican/Democratic, and are thus noncompetitive.
Comparing this map of competitive races to the maps of ad buys, it’s clear that Republicans and Democrats both tend to run the most ads in the races believed to be most competitive. The barplot below displays the total number of ads run in 2018, based on the competitiveness of the congressional district (again, using race ratings from Cook).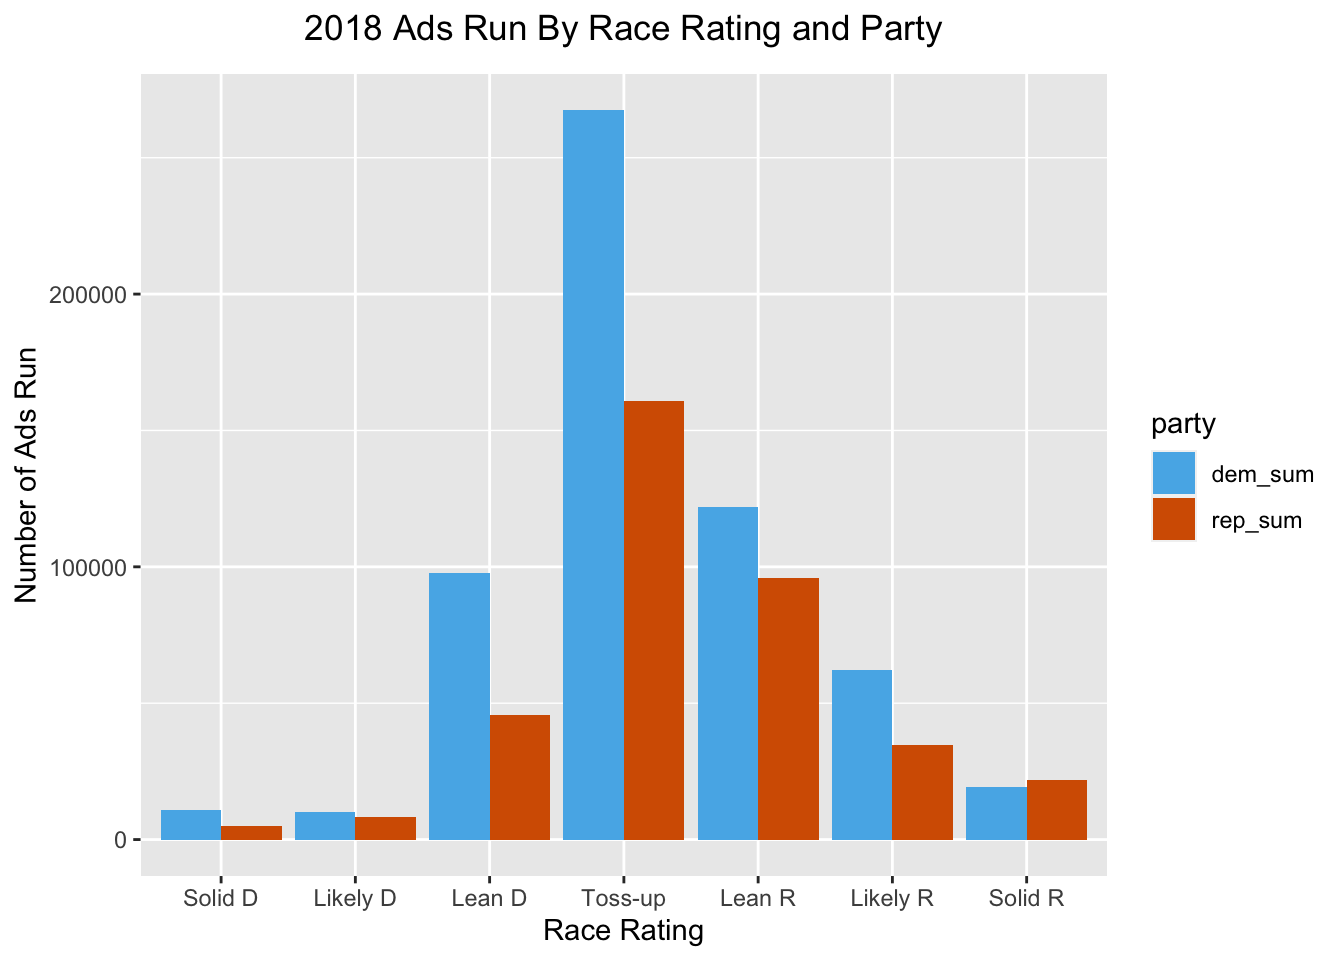
Clearly, by far the most popular place to run ads were toss-up and lean districts, with Democrats outpacing Republican ad buys in nearly every category. The barplot below finds the average number of ads run in each congressional district, again sorted by Cook’s race ratings.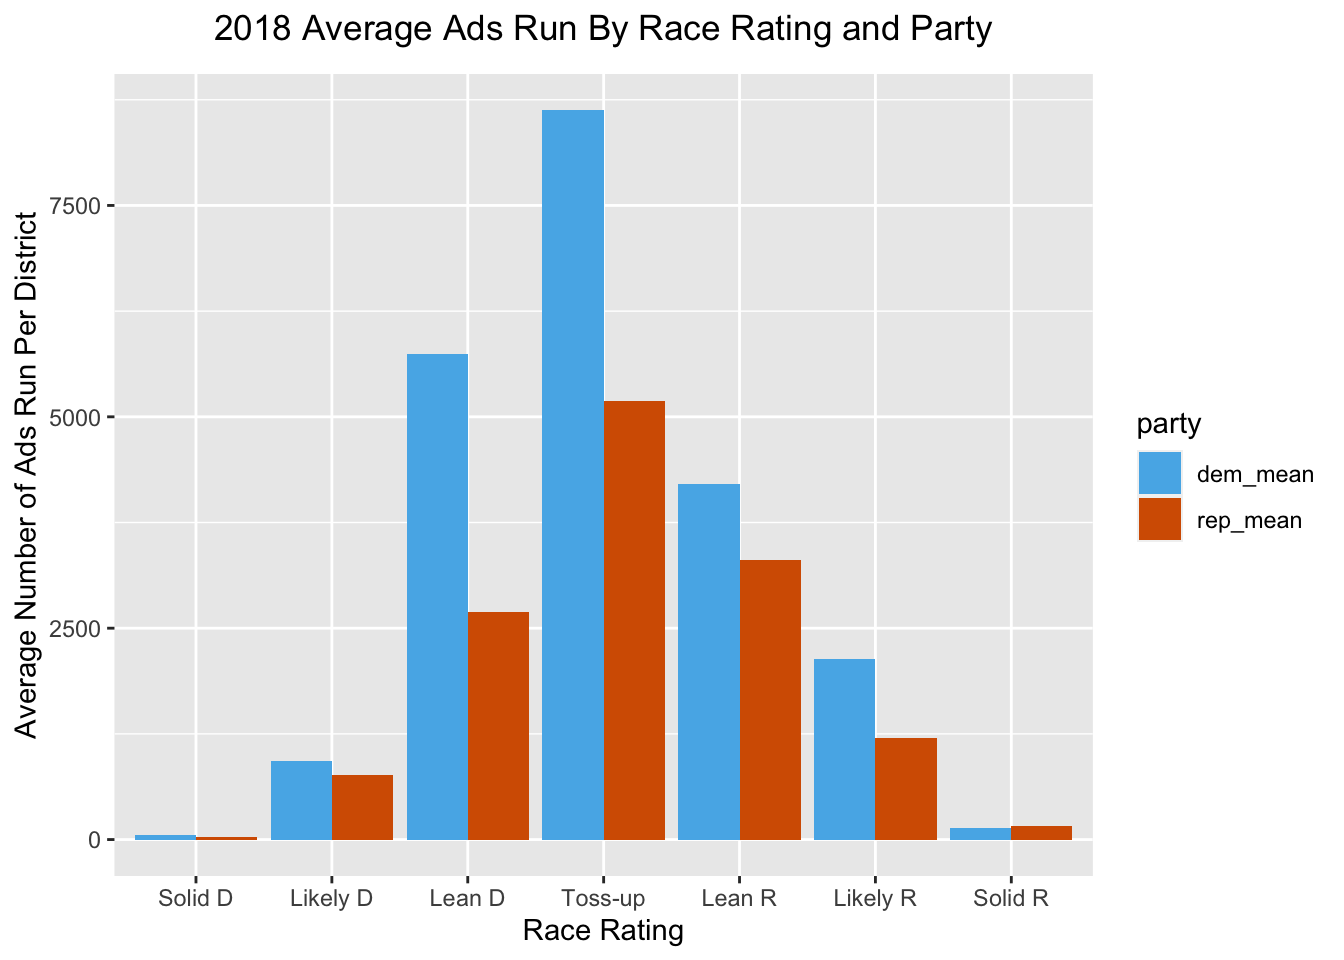
Once again, ad-spending is concentrated in competitive seats. By observing the average number of ads per district (rather than just the total number of ads by category), it is especially clear how few ads are run in solid Democratic and Republican seats.
Does Advertising Predict Election Results?
Now, I’ll turn to examining the relationship between advertising and election results. Rather than simply considering the raw number of ads run by Democrats or Republicans, my dependent variable will be the proportion of total ads in a district run by either Democrats or Republicans. After, the fact that Republicans ran 5,000 ads in a district may or may not be useful information, depending on how many ads Democrats won. If Republicans ran 5,000 ads and Democrats only ran half of that, we might expect these ads to predict stronger Republican performance. But if Democrats ran around the same number of ads, advertising data might not tell us much about which party is likely to win the race. Thus the scatterplot below compares the proportion of a congressional district’s two-party vote won by Republicans with the proportion of total ads in the district run by Republicans.
Note that this model only considers congressional districts in which both Republicans and Democrats ran ads. But as previously discussed, this means that we are generally only considering more competitive districts (since both parties usually only run ads in competitive districts).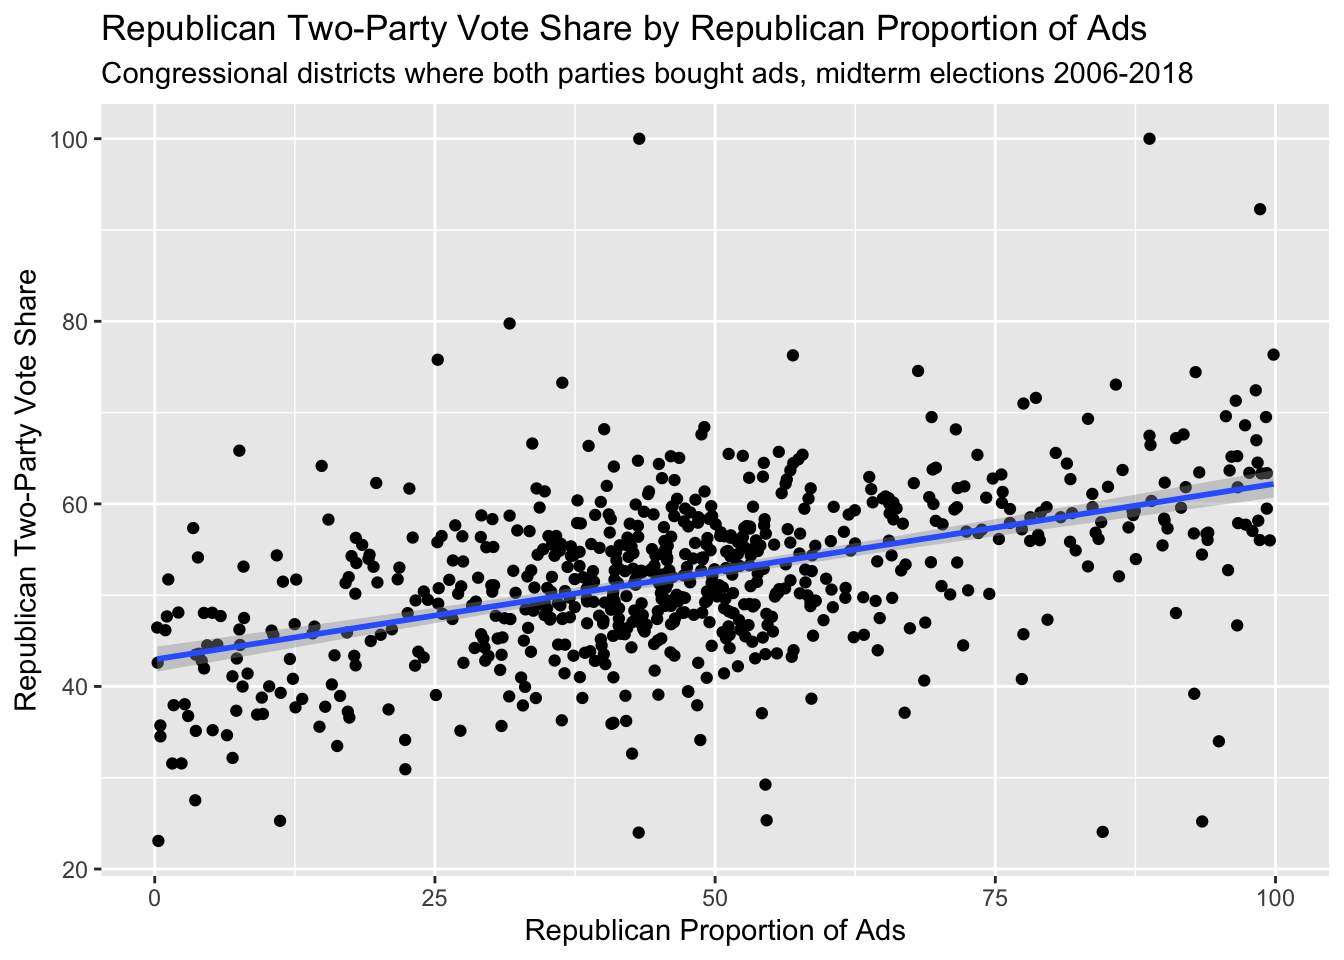
Below is the regression output for the relationship between Republican two-party vote share and the Republican proportion of ads.
| Rep Votes Major Percent | |||
|---|---|---|---|
| Predictors | Estimates | CI | p |
| (Intercept) | 42.96 | 41.58 – 44.34 | <0.001 |
| rep ad prop | 0.19 | 0.17 – 0.22 | <0.001 |
| Observations | 687 | ||
| R2 / R2 adjusted | 0.232 / 0.231 | ||
There is a statistically significant relationship between two-party vote share and proportion of ads run. Though with an R-squared of around 0.23, this is not a highly predictive model. I also attempted to make separate district-level models, but given that we only have election data from four election years, few of these regressions were statistically significant. In fact, many districts only saw parties buy ads in one or two election cycles, meaning that some of the district-level models were being generated based only on one or two data points.
Overall, by building a model based on all congressional districts with ad purchases from both parties, I was able to identify a positive relationship between partisan ad proportion and partisan vote share, albeit a relatively weak one. One important pitfall to consider is that simply adding the number of ads run by each of the political parties may not be the most accurate way to measure the effect of these ads. Some ads may reach a broader audience than others, depending on the television programs and geographic markets it was aired on. Measures like Gross Ratings Points (GRP) that consider the audience reached by ads may be more exact means of estimating the effects of advertising.