on
Blog 4: Expert Predictions and Incumbency
This blog is an ongoing assignment for Gov 1347: Election Analytics, a course at Harvard College taught by Professor Ryan Enos. It will be updated weekly and culminate in a predictive model of the 2022 midterm elections.
This week, I’ll focus on the value of expert predictions and incumbency in building my model for the 2022 midterms. First, I’ll analyze the accuracy of experts in predicting the 2018 midterm elections, completing blog extensions 1 and 2. Next, I’ll return to the models I built last week to consider the importance of incumbency and expert predictions.
Assessing the Accuracy of Expert Predictions
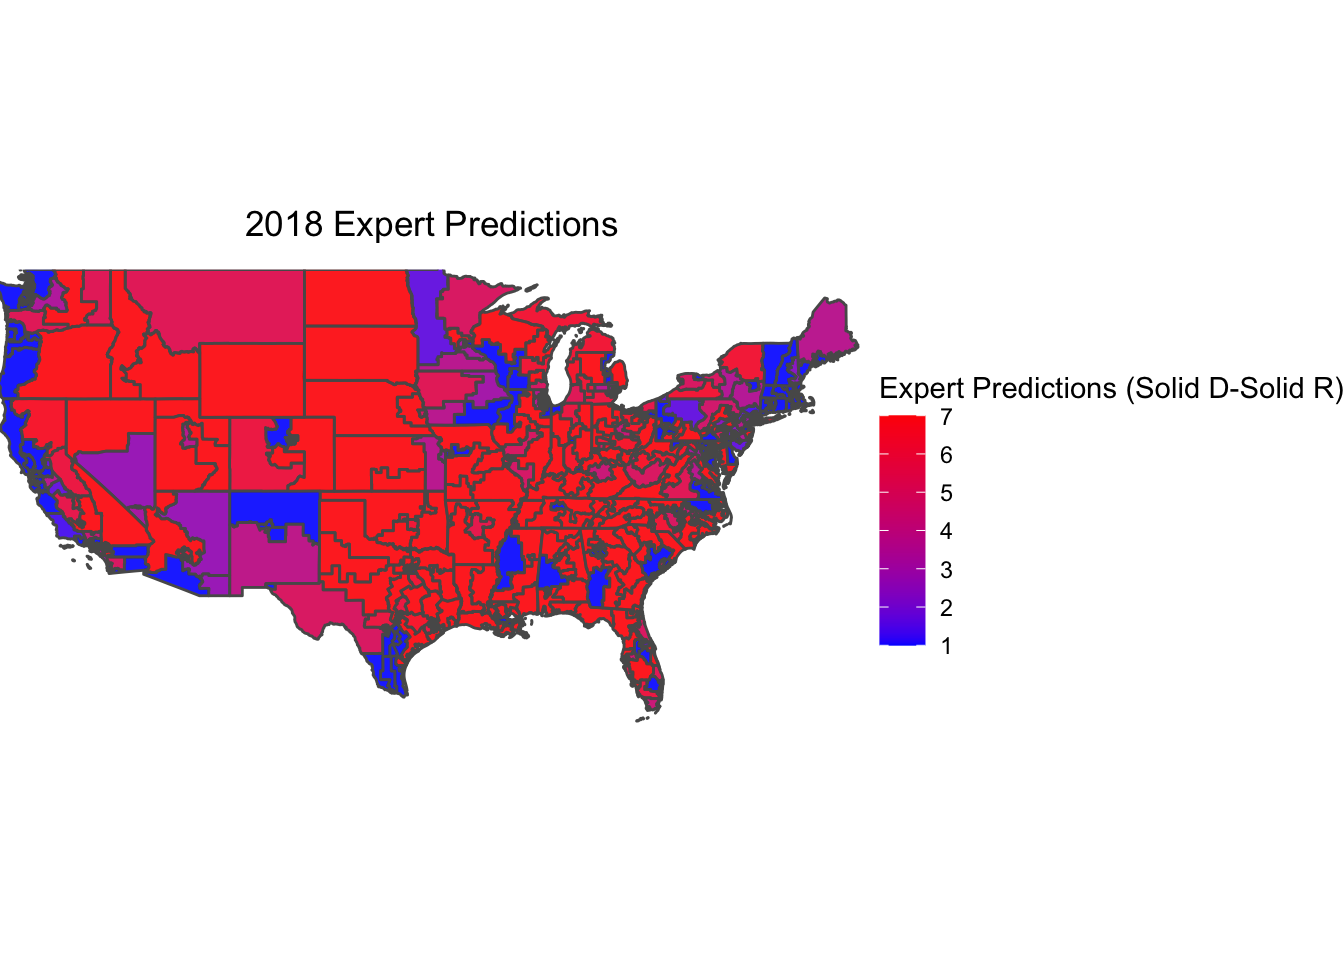
Many political scientists, media organizations, and think tanks put forward predictions for the 2018 midterms. In this blog post, I’ll assess the accuracy of the predictions from the Cook Political Report, Inside Elections, and Larry Sabato’s Crystal Ball. I decided to focus on these three expert prediction houses for a few main reasons. First, they’re all generally well-respected and trusted: FiveThirtyEight actually incorporates their forecasts in its “Deluxe” model. Second, Cook, Inside Elections, and Crystal Ball use similar scales to rate the competitiveness of races, which allows for easy comparison. I’ve assigned scores ranging from 1 to 7 to the race ratings. Scores 1 through 3 represent congressional districts predicted to vote Blue (Solid Dem, Likely Dem, and Lean Dem), and scores 5 through 7 represent congressional districts predicted to vote Red (Lean Rep, Likely Rep, and Solid Rep). A score of 4 represents a pure toss-up seat. Note that Crystal Ball uses “Safe” Dem/Rep as an analog for what Cook and Inside Elections call “Solid” seats. Additionally, Inside Elections has “Tilt” Dem/Rep ratings for districts between toss-ups and leans, which I’ve thus coded as 3.5 and 4.5, respectively.
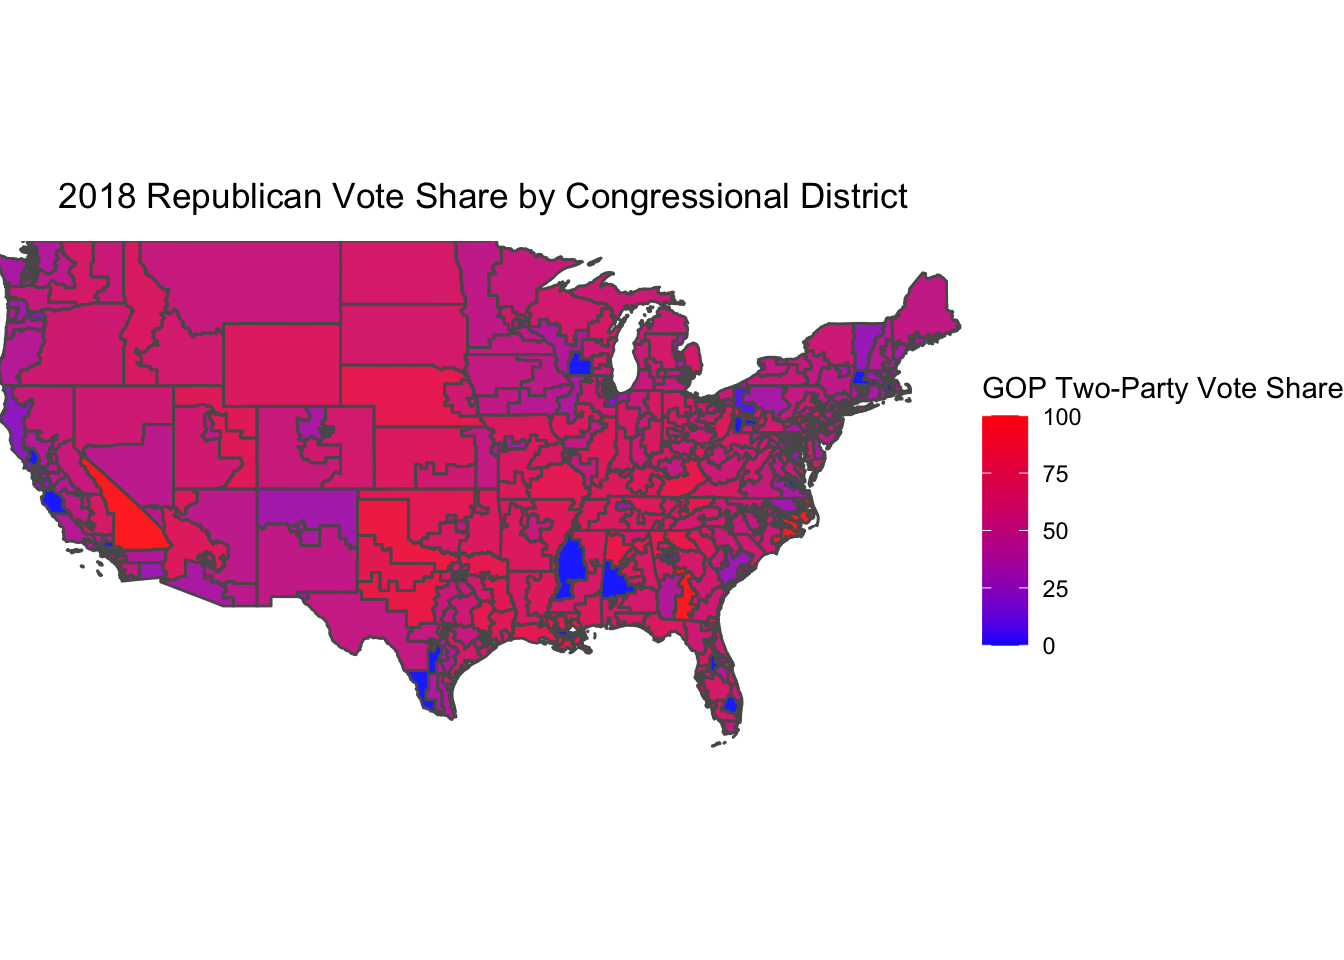
The following map displays the true two-party Republican vote share in congressional districts in the 2018 House election.
Now, plotted below is the 7-point scale race rating for each congressional district, calculated by averaging the race ratings from Cook, Inside Elections, and Crystal Ball.
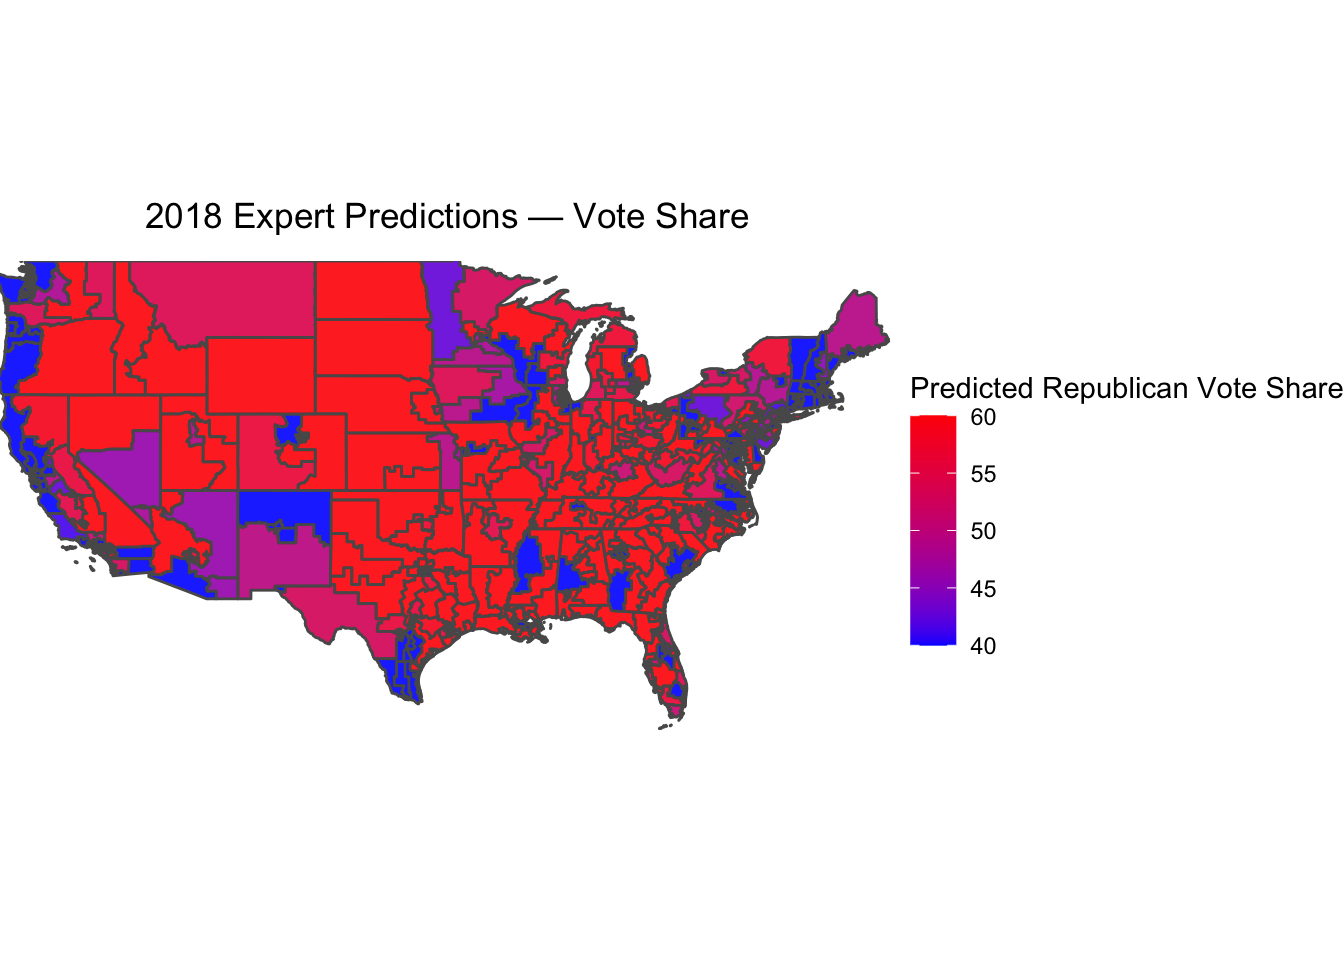
 The expert ratings seem to broadly align with district vote share. But for a more direct comparison, I will translate the race ratings into vote share measures. I define a toss-up district as one where Republicans and Democrats are projected to tie 50-50 in the two-party vote, a lean district with a predicted 53-47 result, a likely district with a predicted 56-44 result, and a solid district with a predicted 60-40 result. This is, of course, fairly arbitrary, but it provides a useful heuristic for comparing expert predictions with actual results. This “predicted” vote share is mapped below.
 Finally, the following map plots the difference between the expert-predicted vote share and actual vote share at the congressional-district level.
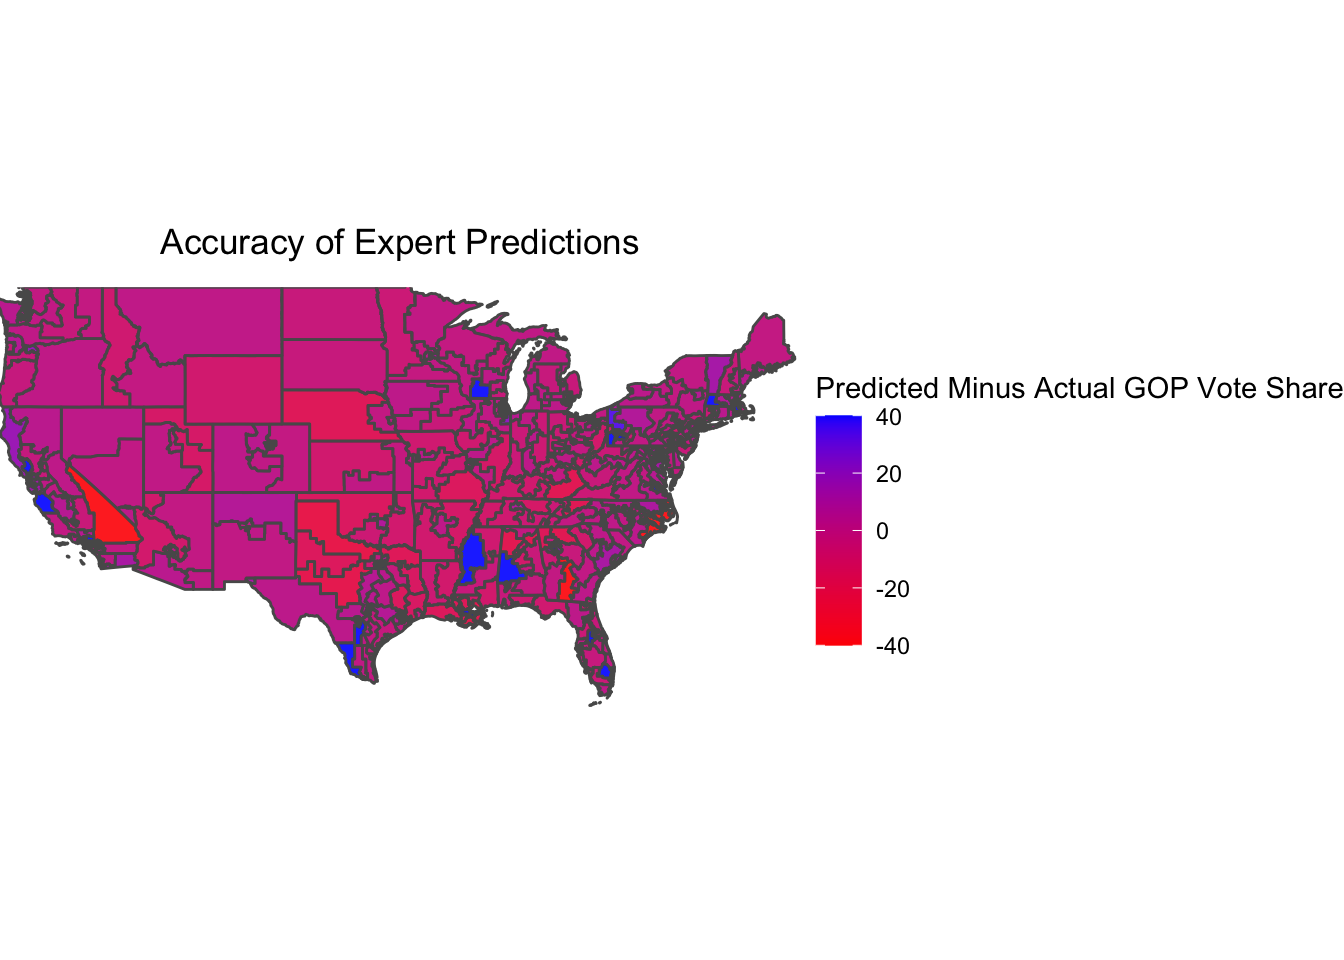 Positive (blue) values represent districts where Democrats performed better than the experts predicted, and negative (red) values represent districts where Republicans performed better than the experts predicted. For the most part, congressional districts are colored purple, suggesting fairly accurate predictions. And in the few races where there is significant error — such as California’s 8th district or Alabama’s 7th district — the large difference between the predicted and actual vote share was the result of the incumbent candidate running unopposed. Because a Solid Dem/Rep race predicts a 60-40 margin, there will be an error of 40 percentage points if the incumbent runs without partisan opposition. This again speaks to the limits of assigning predicted vote share values to probabilistic race ratings.
But perhaps the most direct way to assess the accuracy of these types of expert predictions is to calculate the number of races called correctly. After all, the goal of these ratings is not to determine by what margin a candidate will win a district, but rather the likelihood they will win at all. The following charts display the accuracy of Cook, Inside Elections, and Crystal Ball’s 2018 race ratings. Any district in the Republican basket (whether it’s lean Republican or solid Republican) is considered a projected Republican victory.
| Winning_Party | Projected_Rep | Projected_Dem | Projected_Tossup |
|---|---|---|---|
| D | 4 | 210 | 21 |
| R | 191 | 0 | 9 |
| Winning_Party | Projected_Rep | Projected_Dem | Projected_Tossup |
|---|---|---|---|
| D | 8 | 213 | 14 |
| R | 194 | 0 | 6 |
| Winning_Party | Projected_Rep | Projected_Dem | Projected_Tossup |
|---|---|---|---|
| D | 9 | 226 | 0 |
| R | 197 | 3 | 0 |
| Winning_Party | Projected_Rep | Projected_Dem | Projected_Tossup |
|---|---|---|---|
| D | 9 | 226 | 0 |
| R | 197 | 3 | 0 |
Upon first glance, it seems Cook’s forecasts were most accurate — only 4 races were called incorrectly. But Cook was also the most cautious — it kept 30 districts in the toss-up pile, whereas Inside Elections only had 20 toss-up districts, and Crystal Ball and the average of the three forecasters had 0 toss-ups. Across the board, the forecasters seemed to underestimate the Democrats. For all three forecasters, a greater proportion of the projected Republican seats went Democratic than projected Democratic seats that went Republican. In fact, not a single seat projected by Cook or Inside Elections to go Democratic actually voted red. Overall, the expert predictions from all three forecasters seem fairly accurate, though the fact that they all underestimated Democrats is concerning. It suggests that there could be underlying variables advantaging Democrats that these fairly subjective methods of election forecasting do not consider.
The Role of Experts and Incumbency in My Model
For this week, I’m not going to construct a brand new model, as my predictions from last week already consider aspects of incumbency and expert prediction. My national popular vote model, shown in the below chart, predicts the two-party vote share of the incumbent president’s party, drawing on the obsveration that the president’s party often fares poorly in midterm election years, especially under bad economic conditions.
| incumbent pres majorvote | ||||
|---|---|---|---|---|
| Predictors | Estimates | std. Error | CI | p |
| (Intercept) | 27.83 | 2.58 | 22.57 – 33.10 | <0.001 |
| incumbent pres polls | 0.43 | 0.05 | 0.32 – 0.53 | <0.001 |
| GDP growth pct | 0.15 | 0.27 | -0.40 – 0.71 | 0.579 |
| midterm dummy | -0.71 | 0.65 | -2.03 – 0.61 | 0.279 |
| Observations | 36 | |||
| R2 / R2 adjusted | 0.716 / 0.689 | |||
My district-level model, with predictions displayed below, also considers expert predictions as a heuristic by relying on the Cook Political Report’s Partisan Voter Index when district-level polling data is unavailable.
| model | PVI | PVI_polls |
|---|---|---|
| Dem Wins | 208.00 | 209.00 |
| Rep Wins | 227.00 | 224.00 |
| Tied Seats | 0.00 | 2.00 |
| Dem Seat Share | 0.48 | 0.48 |
| Rep Seat Share | 0.52 | 0.51 |
This, to me, seems like the optimal use of expert predictions in constructing my own forecast of the 2022 midterms — using expert opinion to fill gaps when polls and other data are unavailable. I’ve decided against more directly incorporating expert predictions into my model for a number of reasons. First, it to some extent defeats the purpose of election forecasting as an intellectual, exploratory enterprise if my model is simply derived by compiling other predictions and models. As Nate Silver points out when discussing his Deluxe forecast, “it’s kind of cheating to borrow other people’s forecasts and make them part of our own.” Second, simply aggregating expert predictions may not produce a more accurate result if all of the expert predictions are off in the same direction. As we saw in 2018, all three major forecasters underestimated Democrats on net. Expert predictions are a useful tool for filling missing gaps in the data and gaining a better sense of the national electoral environment, but they won’t form the central basis for my 2022 midterms model.