on
Blog 3: Polling
This blog is an ongoing assignment for Gov 1347: Election Analytics, a course at Harvard College taught by Professor Ryan Enos. It will be updated weekly and culminate in a predictive model of the 2022 midterm elections.
In this week’s blog, I will be incorporating polling into my predictive modeling. I will create predictions using polling in two ways. First, I’ll update a version of my economic fundamentals model from last week with polling data. Next, I’ll incorporate district-level polls and partisanship indicators to forecast seat share in the 2022 midterms, completing blog extension 3.
National Popular Vote Model
Pure Economic Fundamentals Model
I’ll begin with forecasting the popular vote. Last week, I considered a number of ways to model elections based on economic data. For this week, I’ll use an economic model that predicts the popular vote of the incumbent president’s party based on quarter 5 GDP growth (the GDP growth at the start of the election year). Quarter 5 growth is used since this data is available for the 2022 election cycle and can thus be used to predict the 2022 midterms. I’ve also included a midterm dummy variable, which has a value of 1 if it’s a midterm election year and a value of 0 if it’s a presidential election year. The model output is displayed below:
| incumbent pres majorvote | ||||
|---|---|---|---|---|
| Predictors | Estimates | std. Error | CI | p |
| (Intercept) | 48.22 | 0.87 | 46.44 – 50.00 | <0.001 |
| GDP growth pct | 0.85 | 0.44 | -0.05 – 1.74 | 0.064 |
| midterm dummy | -1.15 | 1.10 | -3.40 – 1.10 | 0.306 |
| Observations | 36 | |||
| R2 / R2 adjusted | 0.142 / 0.090 | |||
With an R-squared value of 0.142, this is not a very good model. As we might expect, the coefficient for the midterm dummy is negative, given the conventional wisdom that we generally expect the incumbent president’s party to fare poorly in the midterms. But given that the p-value for the midterm variable is around 0.3, we should be highly skeptical of its predictive power. The following scatter plot shows the actual versus predicted popular vote share of the incumbent president’s party in past elections based on my fundamentals-only model.
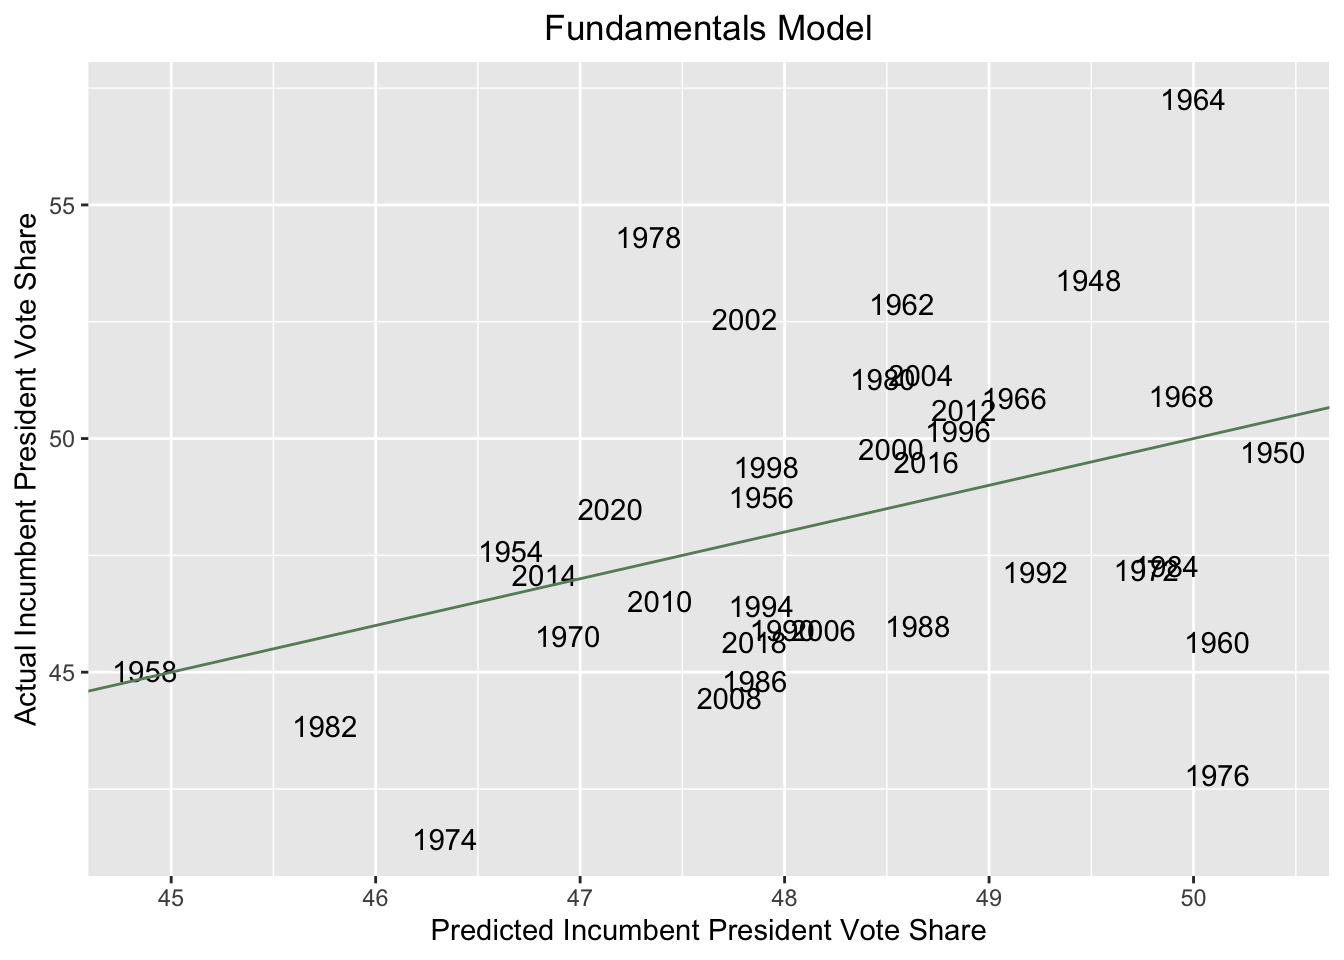
Clearly, the residuals are quite large, again suggesting that this model is not optimal. Using first quarter GDP growth from 2022, this model predicts that the incumbent president’s party (the Democrats) will win around 48.42% of the two-party popular vote.
Pure Polling Model
Next, I’ll build a model solely based on polling data. I will predict the incumbent president’s party’s two-party popular vote share based on generic ballot polling. I’ll determine each election year’s polling average by taking an average of all polls conducted within 45 days of election day. For the sake of simplicity, I will not weigh the polls based on pollster quality — FiveThirtyEight, for example, weights polls based on the past predictive performance of the pollster in question. I will also not weigh polls based on their proximity to election day. As I continue to refine my model, I will consider different methods of weighting polls, drawing on the work of forecasters at FiveThirtyEight, The Economist, and other outlets. But for the purpose of this blog, which is focused on reconciling fundamentals- and polling-based models, I’ll go with a more parsimonious approach. The output for this polling model is shown below:| incumbent pres majorvote | ||||
|---|---|---|---|---|
| Predictors | Estimates | std. Error | CI | p |
| (Intercept) | 26.77 | 2.43 | 21.84 – 31.71 | <0.001 |
| incumbent pres polls | 0.44 | 0.05 | 0.34 – 0.54 | <0.001 |
| Observations | 36 | |||
| R2 / R2 adjusted | 0.701 / 0.692 | |||
Clearly, with an R-squared of around 0.701, this polling-based model is far more predictive than my previous economics-only model. A scatterplot comparing predicted and actual two-party vote share values is shown below
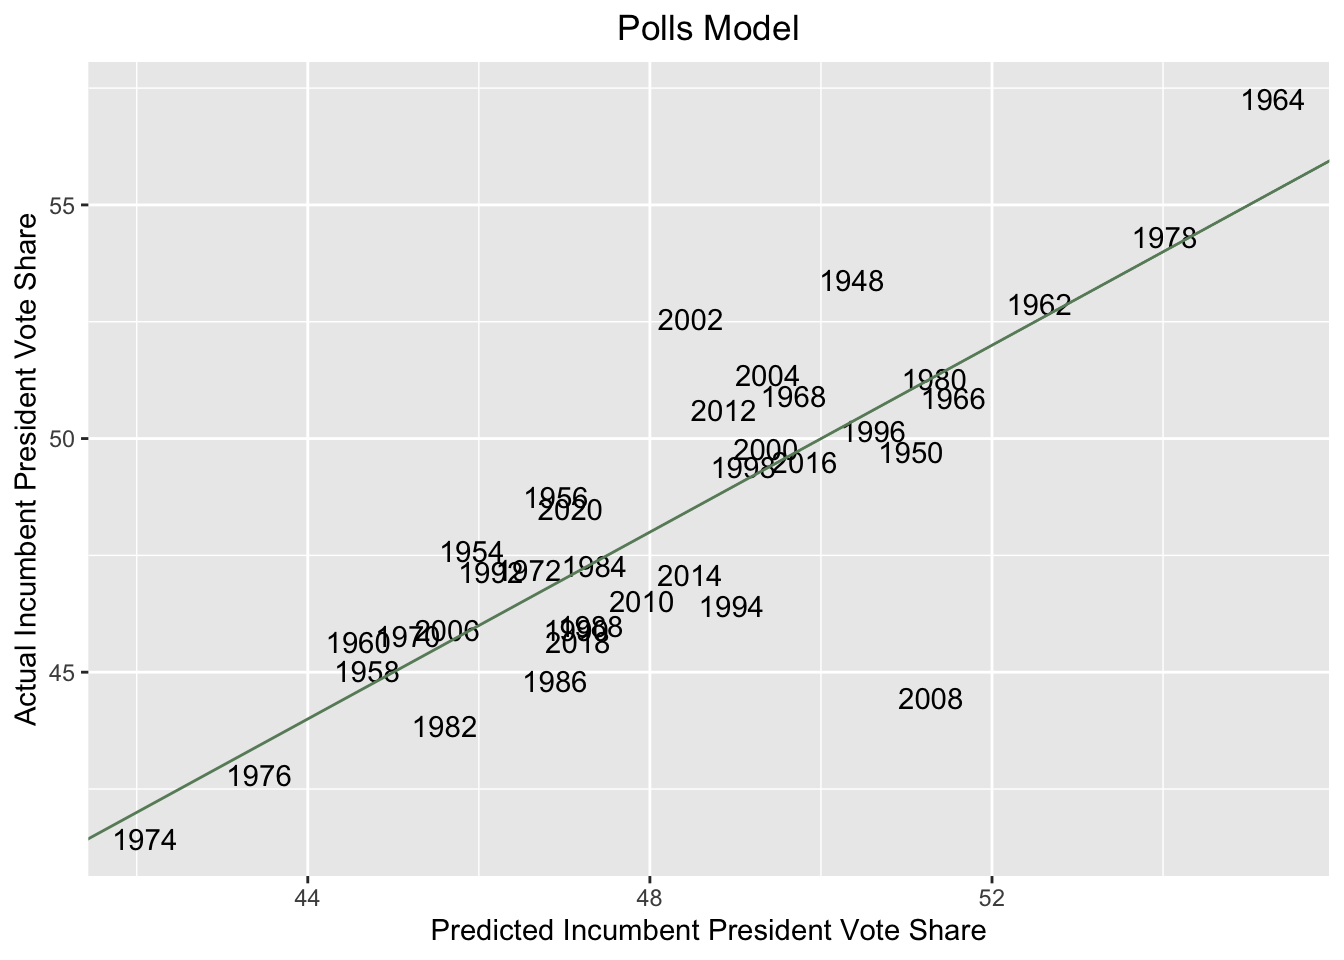
This model provides a much better fit of the data, with most election years falling on or near the 45 degree line. Averaging polls from the start of August to mid-September (roughly 45 days of polling) to determine the present 2022 polling average, this model predicts that the incumbent president’s party (the Democrats) will win around 49.36% of the two-party popular vote.
Combined Model
Finally, I’ll combine these two models to predict the popular vote based on both economic fundamentals and polling data. The multivariate regression, based on quarter 5 GDP growth, the polling average, and the midterm binary variable, is shown below.| incumbent pres majorvote | ||||
|---|---|---|---|---|
| Predictors | Estimates | std. Error | CI | p |
| (Intercept) | 27.83 | 2.58 | 22.57 – 33.10 | <0.001 |
| incumbent pres polls | 0.43 | 0.05 | 0.32 – 0.53 | <0.001 |
| GDP growth pct | 0.15 | 0.27 | -0.40 – 0.71 | 0.579 |
| midterm dummy | -0.71 | 0.65 | -2.03 – 0.61 | 0.279 |
| Observations | 36 | |||
| R2 / R2 adjusted | 0.716 / 0.689 | |||
This model does not seem much more predictive than the polls-only model. In fact, the adjusted R-squared is actually very slightly lower for the combined model than the polls-only model. This might suggest that we could remove the economic data from our model without affecting the predictiveness of the model. This is not to say that economic trends and other fundamentals do not matter at all in the midterms — it may just be that the chosen value of GDP growth is not a very useful predictor. Going forward, I’ll consider how to incorporate other indicators of the baseline political environment; I may use presidential approval ratings, for example, as a means of gauging election fundamentals.
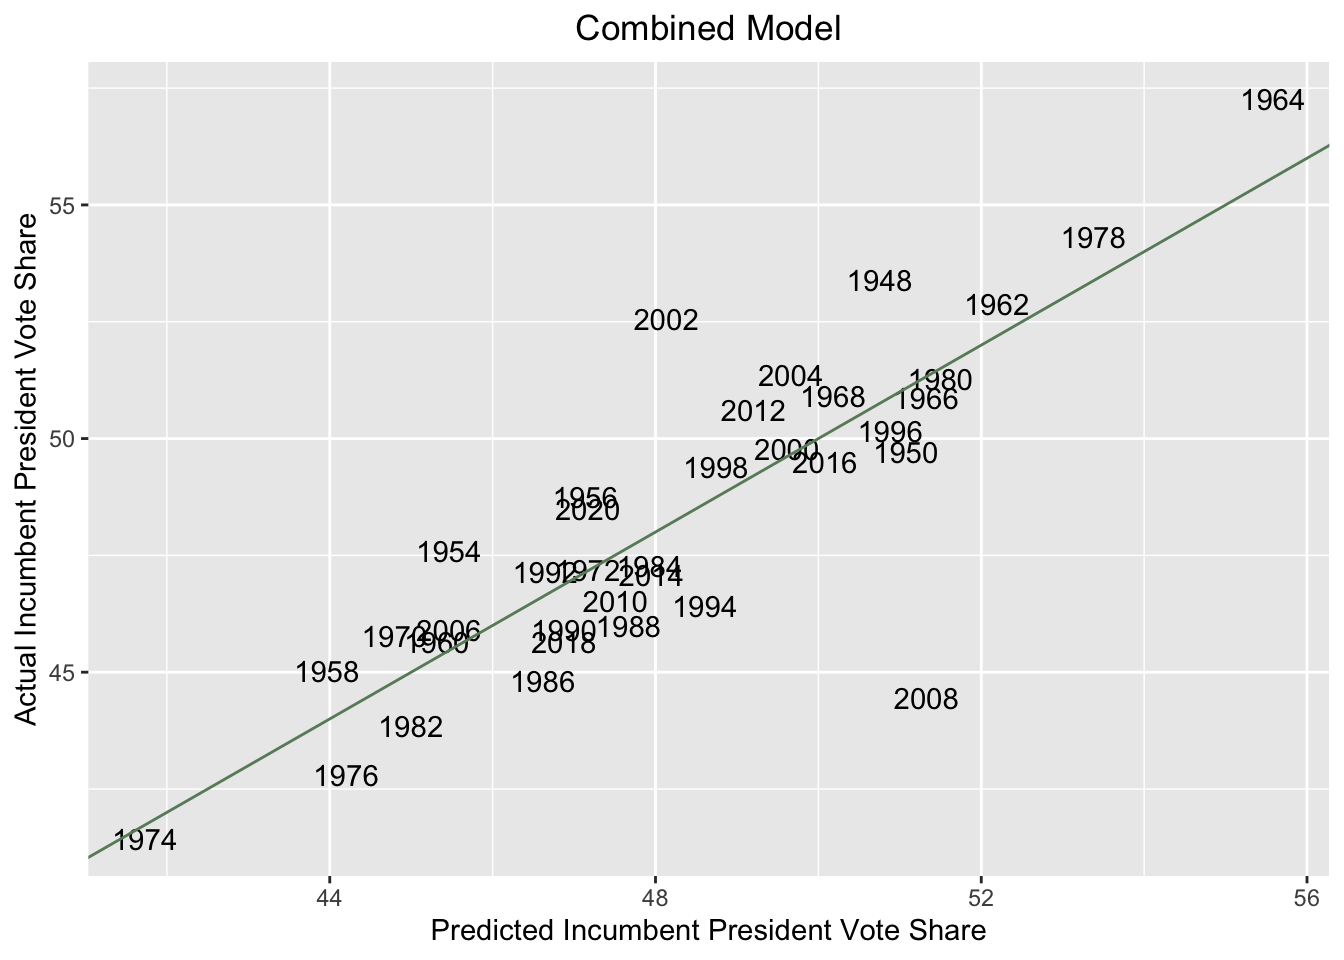
Again, there does not seem to be much improvement in model accuracy relative to my polls-only model. Using the previously mentioned data from 2022, this combined model predicts that the incumbent president’s party (the Democrats) will win around 49.09% of the two-party popular vote. The predictions of Democratic two-party vote share for the three models are summarized below:
| model | fundamentals | polls | combined |
|---|---|---|---|
| prediction | 48.42 | 49.36 | 49.09 |
Despite varying significantly in predictive power, all three models predict very similar popular vote shares for the Democrats. The fundamentals-only model is the most pessimistic about Democrats’ chances, which aligns with the thinking that the 2022 midterms are fundamentally a tough cycle for Democrats. The polls-only forecast is more optimistic about the Democrats’ chances, due to recent gains for the Democrats in generic ballot polling. And the combined model is somewhere in the middle, which makes sense given it combines the fundamentals and polling forecasts.
District-Level Polling Model
Of course, thus far I have only considered national generic-ballot polls, not district-level polling. In this next model, I’ll use district-level polling to predict seat share in the 2022 midterms. Unfortunately, polling is not available for every district-level race. Polling is expensive, and there’s little need to poll non-competitive districts. Thus, we need to be able to also predict results for congressional districts that have not been polled this cycle. To deal with this, forecasters like FiveThirtyEight have used algorithms like CANTOR, which are able to infer results in districts that have not been polled based on demographically similar districts that have been polled. For my model, I will use a simpler method to forecast the winner of districts that have little polling data available. The Cook Political Report’s Partisan Voter Index (PVI) measures how Republican or Democratic a district is relative to the nation as a whole, based on presidential election data from previous cycles. For example, a district with a PVI of D+3 is around 3 points more Democratic than the nation as a whole in terms of two-party vote share.
We can’t just use PVI on its own to predict the results of congressional districts since this would presume we’re in a national environment where Democratic and Republican support is equal. But we know from my previous popular vote model that the national environment currently skews Republican: based on my combined fundamentals/polling model, Democrats are only on track to win 49.09 percent of the two-party vote. In other words, relative to electoral equilibrium, Democrats trail by -0.91 percentage points in terms of the two-party vote. If we trust my national popular vote model, we can take this value to represent the national partisan environment from which congressional districts deviate. We can thus predict the two-party outcome in electoral districts by adding our value for national partisanship to the PVI of each district. This method assumes that all districts undergo uniform swing from election to election. This assumption likely fails since some demographically-similar districts may behave differently compared to other groups of demographically-similar districts. But for now, we can use uniform swing as a heuristic.
Outlined below are the outputs for two district-level models. The PVI model simply relies on the PVI of each district, adjusted based on the current national environment. The PVI_polls model only uses this adjusted PVI when polling is unavailable and otherwise defers to the district-level polling.
| model | PVI | PVI_polls |
|---|---|---|
| Dem Wins | 208.00 | 209.00 |
| Rep Wins | 227.00 | 224.00 |
| Tied Seats | 0.00 | 2.00 |
| Dem Seat Share | 0.48 | 0.48 |
| Rep Seat Share | 0.52 | 0.51 |
Both models predict very similar seat counts for the parties, suggesting that PVI with adjustments for the national environment may be a decent stand-in for district-level polling in unpolled districts. Shown below are histograms plotting the distribution of the predicted district partisanship for the two models. (Note that a district partisanship value of 20 means we’d expect Democrats to win roughly 50 + 20 = 70% of the two-party vote.) Plotted on the bottom is the distribution of baseline PVI for all congressional districts, without adjusting for the national environment.
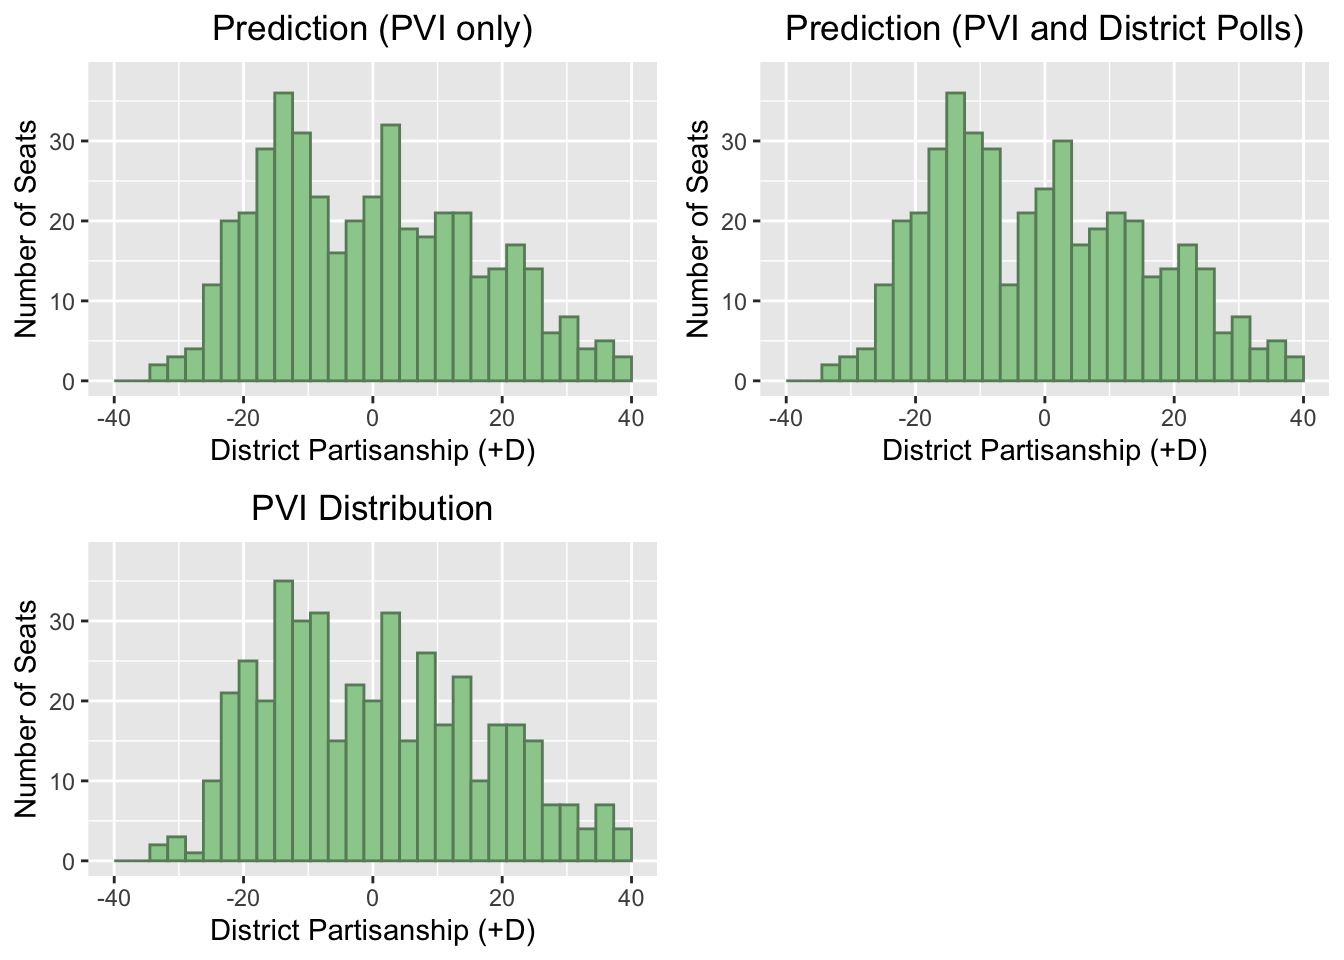
Overall, PVI provides a helpful heuristic for modeling district-level results when district-level polls are unavailable. I’ll continue to explore the value of these types of district ratings as we consider expert predictions next week.